Rworkshop
2022-11-21
Welcome
Welcome to this R workshop for teachers at the faculty of behavioural and social sciences, University of Groningen.
Why this workshop?
You probably know better than I why you signed up for this workshop, but I imagine there are four broad reasons:
You need to do analyses that you cannot do in your (yet) preferred statistical software.
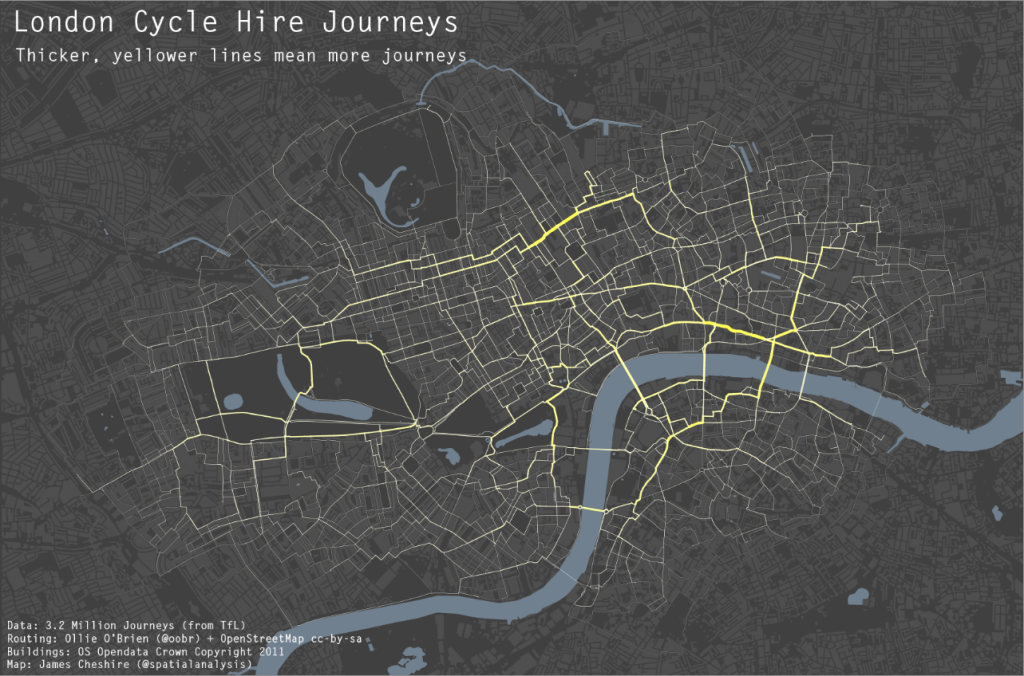
You want to do better data visualizations.
You want to understand what your students are doing. Make no mistake: R is on the way up, SPSS is on the way down.
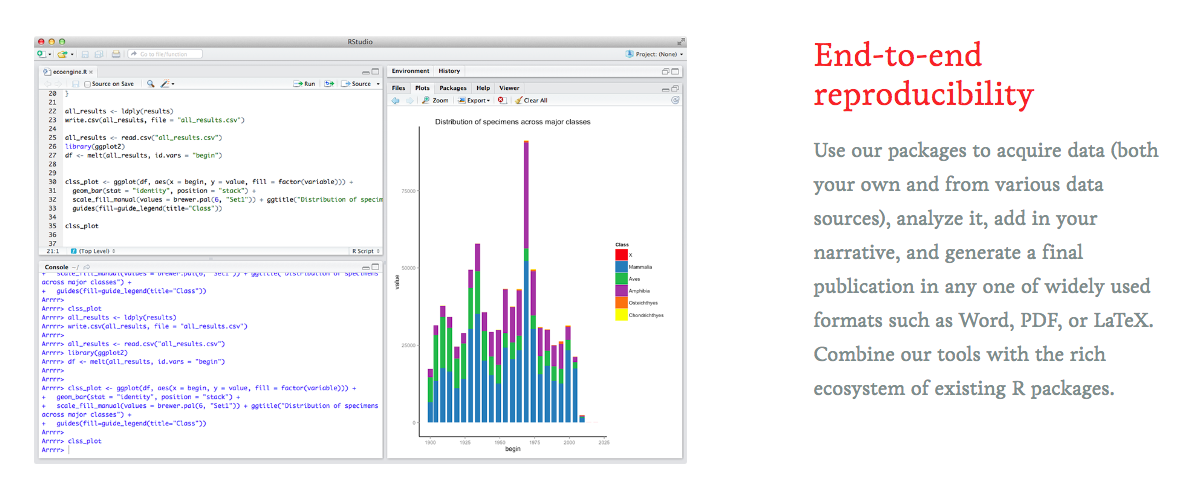
You’d like to work more reproducibly, using open-source software.
Why R?
Some reasons to use R:

You can easily generate stuff:
# Flipping a coin ten times
sample(c("Head", "Tails"), size = 10, replace = TRUE, prob = c(0.5, 0.5))
## [1] "Tails" "Tails" "Head" "Head" "Tails" "Head" "Tails" "Tails" "Head"
## [10] "Head"You can do ‘standard’ analysis, like linear regression:
model <- lm(hwy ~ cty + drv, data = mpg)
summary(model)
##
## Call:
## lm(formula = hwy ~ cty + drv, data = mpg)
##
## Residuals:
## Min 1Q Median 3Q Max
## -4.7830 -0.9041 -0.3083 0.8973 5.0223
##
## Coefficients:
## Estimate Std. Error t value Pr(>|t|)
## (Intercept) 1.99883 0.46622 4.287 2.66e-05 ***
## cty 1.19859 0.03087 38.826 < 2e-16 ***
## drvf 2.22365 0.27027 8.227 1.42e-14 ***
## drvr 2.12501 0.33314 6.379 9.70e-10 ***
## ---
## Signif. codes: 0 '***' 0.001 '**' 0.01 '*' 0.05 '.' 0.1 ' ' 1
##
## Residual standard error: 1.494 on 230 degrees of freedom
## Multiple R-squared: 0.9379, Adjusted R-squared: 0.9371
## F-statistic: 1157 on 3 and 230 DF, p-value: < 2.2e-16You can also do fancy “state-of-the-art” analysis stuff, for example:
- network analyses
- mixed models
- missing data imputation
- bayesian analyses
- making statistical webapplications
You’ll learn about the wonderful world of coding:
passed_the_test <- function(grade) {
    if(grade > 5.5){
        print("You passed the test")
    }
    else {
        print("You failed the test")
    }
}
passed_the_test(8)
## [1] "You passed the test"You can easily and beautifully visualise stuff:
ggplot(mpg, aes(x=cty, y=hwy, colour=drv)) + geom_point() + geom_smooth() + theme_minimal()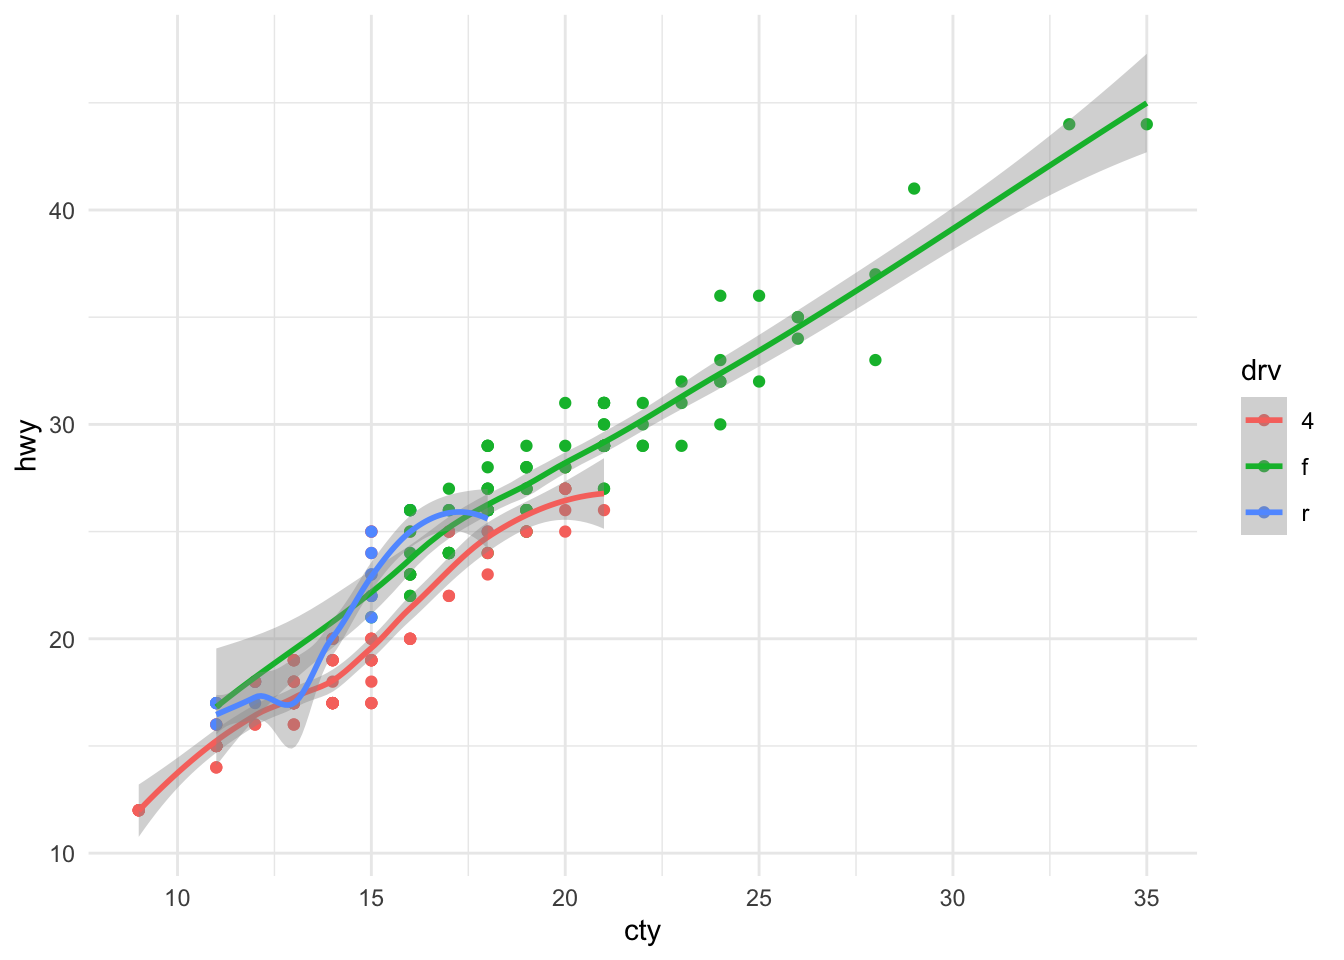
 Source: