Chapter 4 tidy data
The hardest part of visualizing your data is having your data in such a format that you can easily specify what to do with them. A recent helpful concept here is “tidy data”. The wonderful open access book R for Data Science (http://r4ds.had.co.nz/) (Garrett Grolemund 2017), describes tidy data in the following way (http://r4ds.had.co.nz/tidy-data.html):
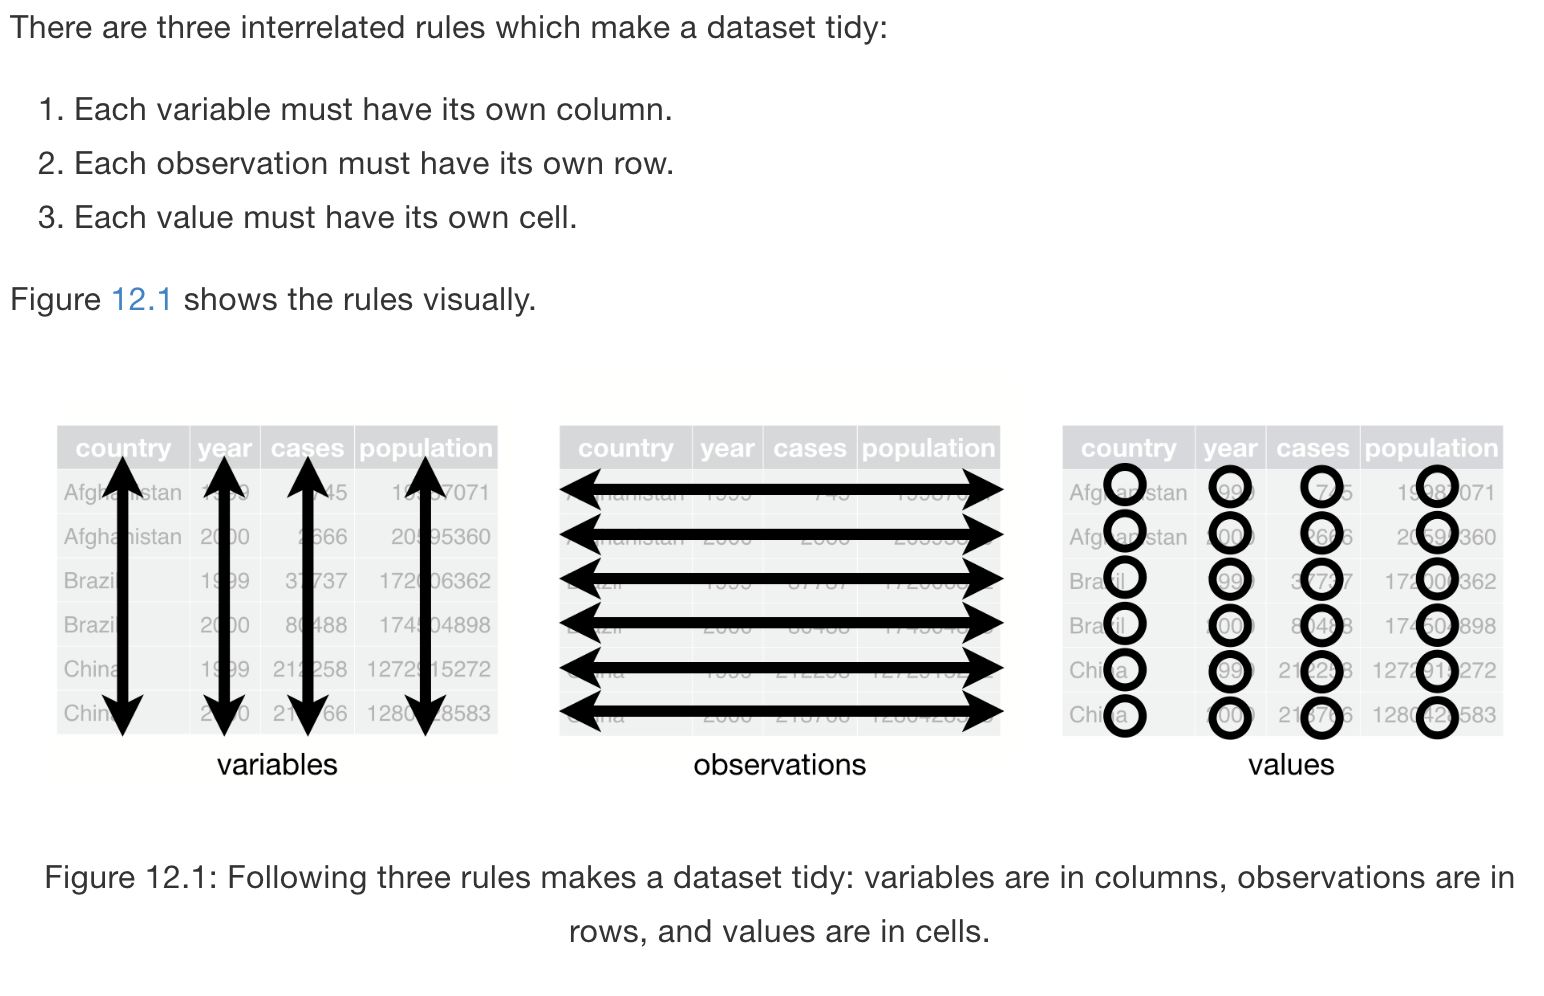
Figure 4.1: Principles of tidy data
See the book on ways to make your data tidy, particularly with the help of functions like spread and gather from the tidyr-package.
4.1 Data manipulation with dplyr
A big advantage of tidy data, is that it allows for easy data manipulation (and visualization). The dplyr-package is particularly useful and intuitive. See also the cheatsheet. We’ll see some data manipulation today, but today we won’t go into it too much. Again, the book “R for Data Science” by Wickham & Grolemund (Garrett Grolemund 2017) is very helpful see here.
References
Garrett Grolemund, Hadley Wickham &. 2017. R for Data Science. 1st ed. California, US: O’Reilly Media. http://r4ds.had.co.nz.