Chapter 7 nodes
7.1 Node attributes
As with the edge attributes, you can set and map different node attributes. Let’s look at those lemurs again. Data from this wonderful website.
lemur_graphml <- read.graph("https://raw.githubusercontent.com/bansallab/asnr/master/Networks/Mammalia/lemur_sexual_weighted/lemur_pereira_sexual_network_1_attribute.graphml", format = "graphml")

lemur <- as_tbl_graph(lemur_graphml)
7.1.1 node colour
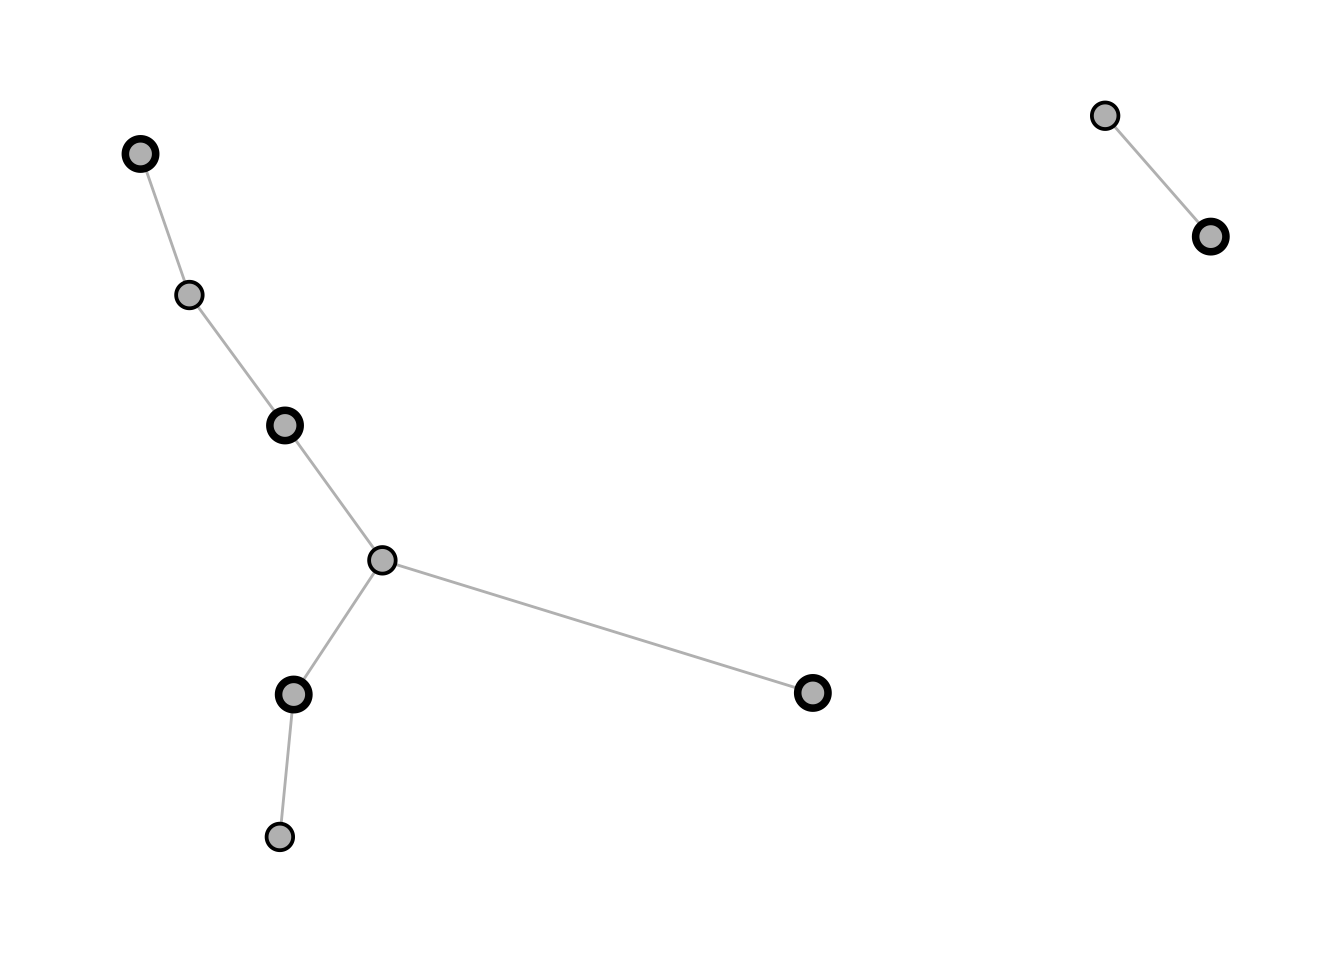
Setting the colour of all nodes:
ggraph(lemur, layout = "kk") +
  geom_edge_link(colour = "grey") +
  geom_node_point(colour = "purple", size = 4) +
  theme_graph()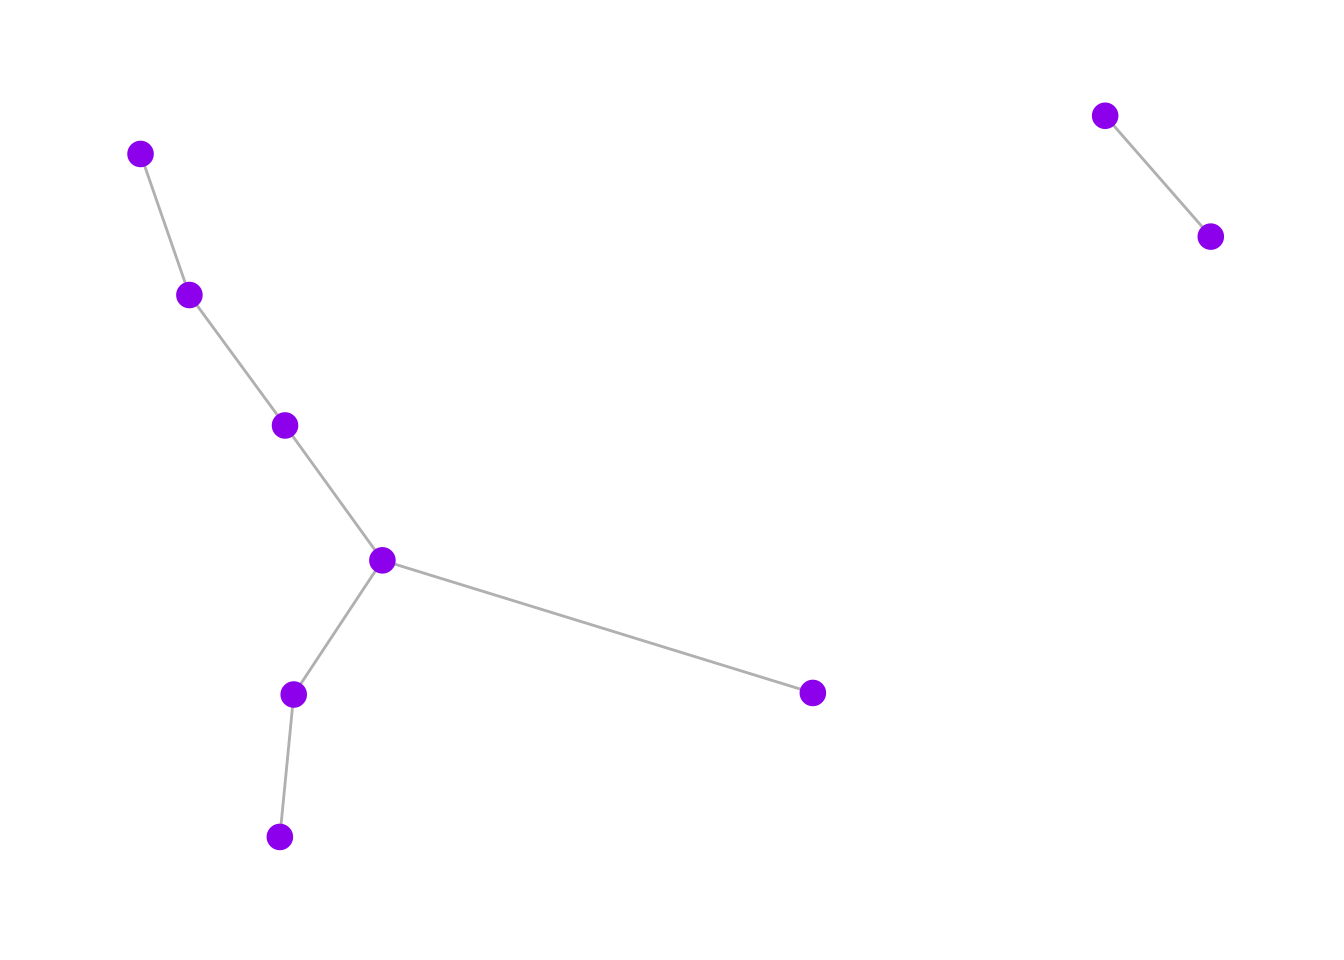
Mapping a variable to node colour:
ggraph(lemur, layout = "kk") +
  geom_edge_link(colour = "grey") +
  geom_node_point(aes(colour = SEX), size = 4) +
  theme_graph()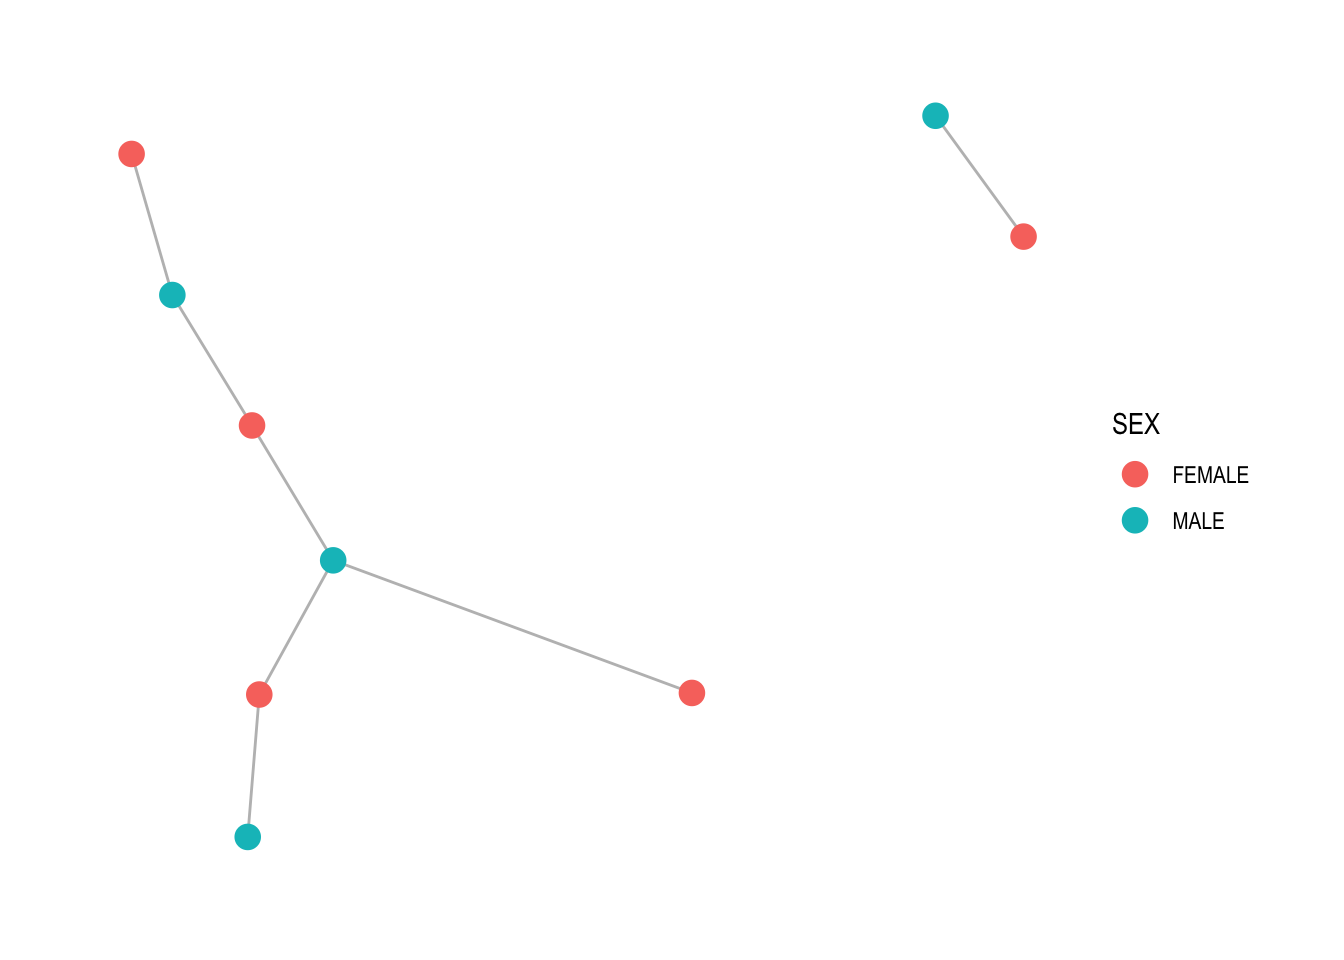
Let’s choose our own colours:
ggraph(lemur, layout = "kk") +
  geom_edge_link(colour = "grey") +
  geom_node_point(aes(colour = SEX), size = 4) +
  theme_graph() +
  scale_colour_manual(values = c("#CC79A7", "#56B4E9"))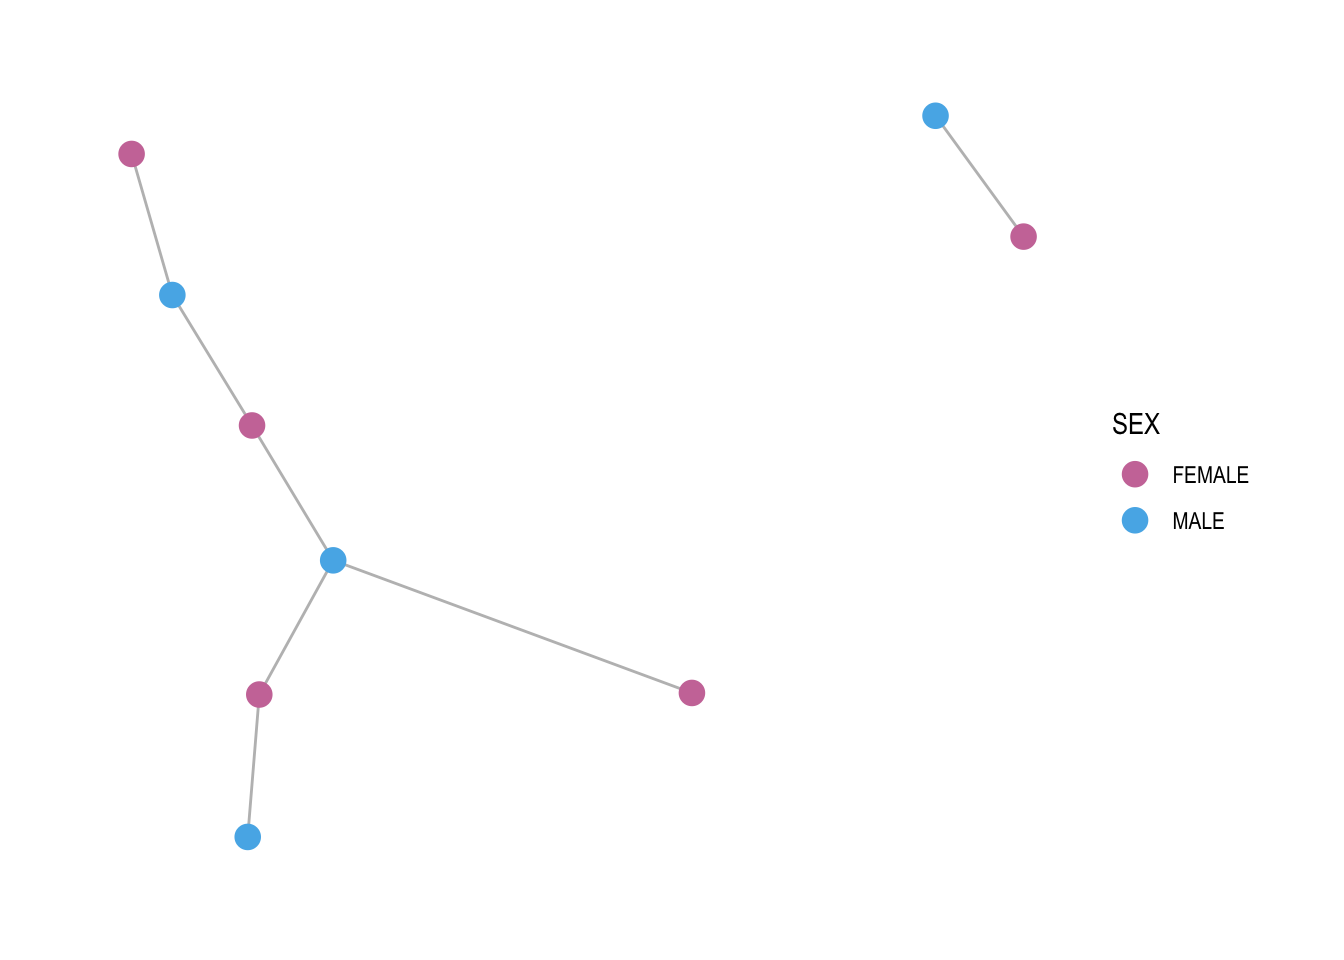
7.1.1.1 node shape
ggraph(lemur, layout = "kk") +
  geom_edge_link(colour = "grey") +
  geom_node_point(aes(shape = SEX), size = 4) +
  theme_graph()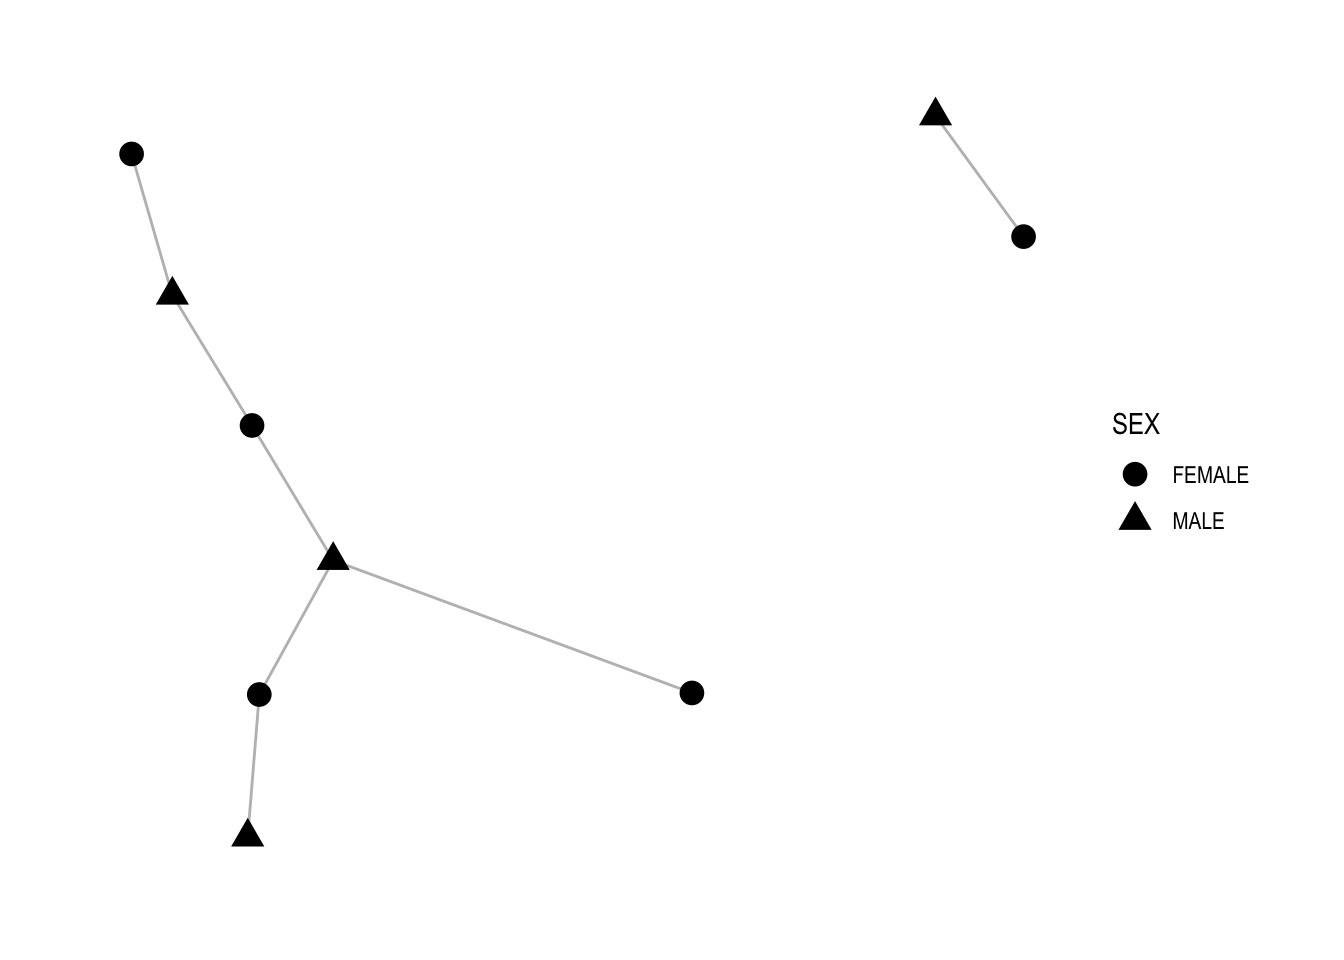
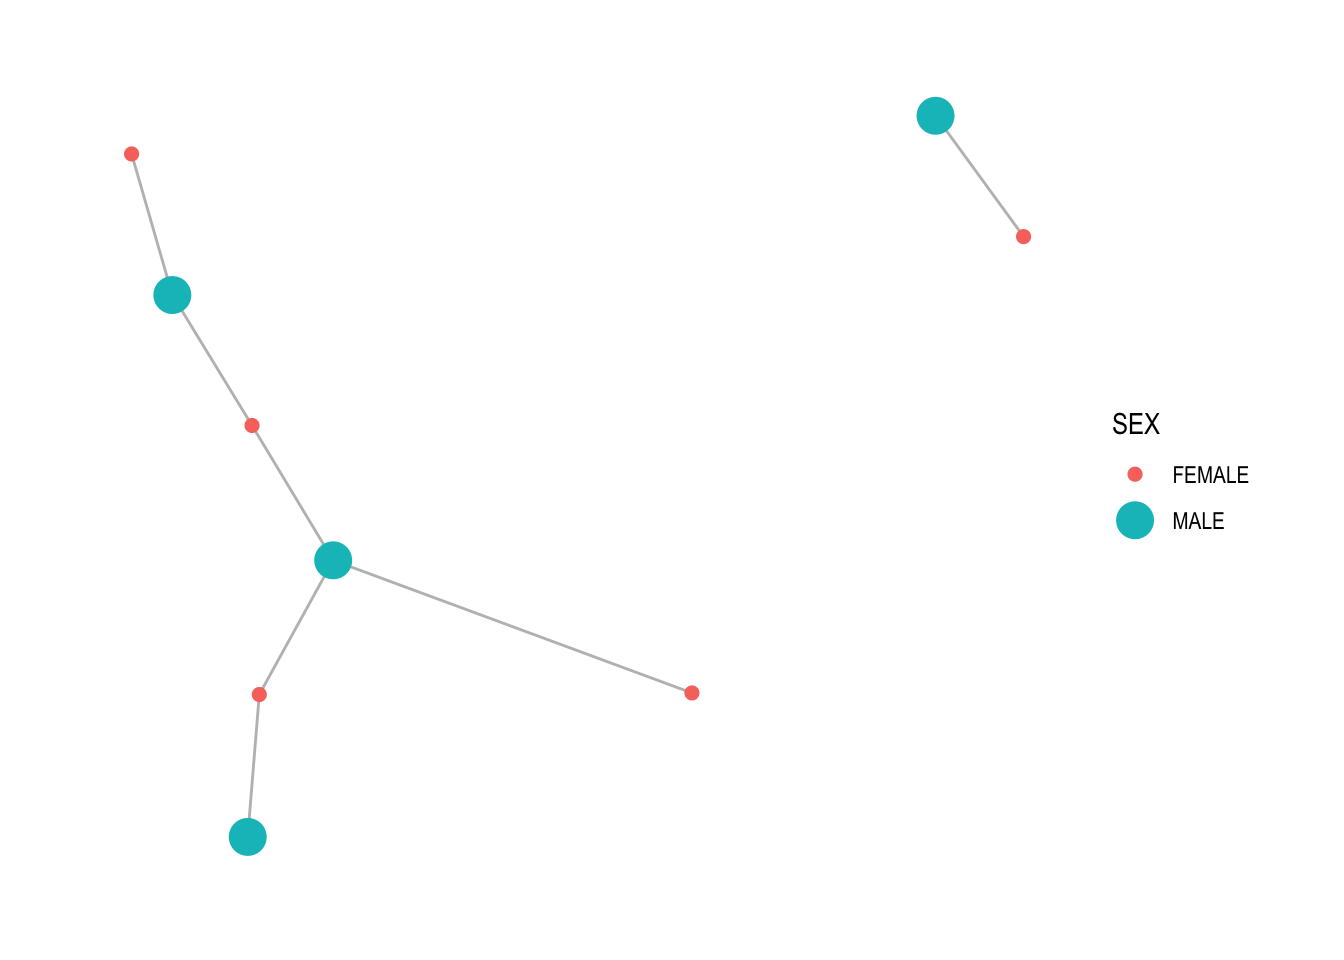
You can always choose to combine multiple “mappings”:
ggraph(lemur, layout = "kk") +
  geom_edge_link(colour = "grey") +
  geom_node_point(aes(shape = SEX, colour = SEX), size = 4) +
  theme_graph()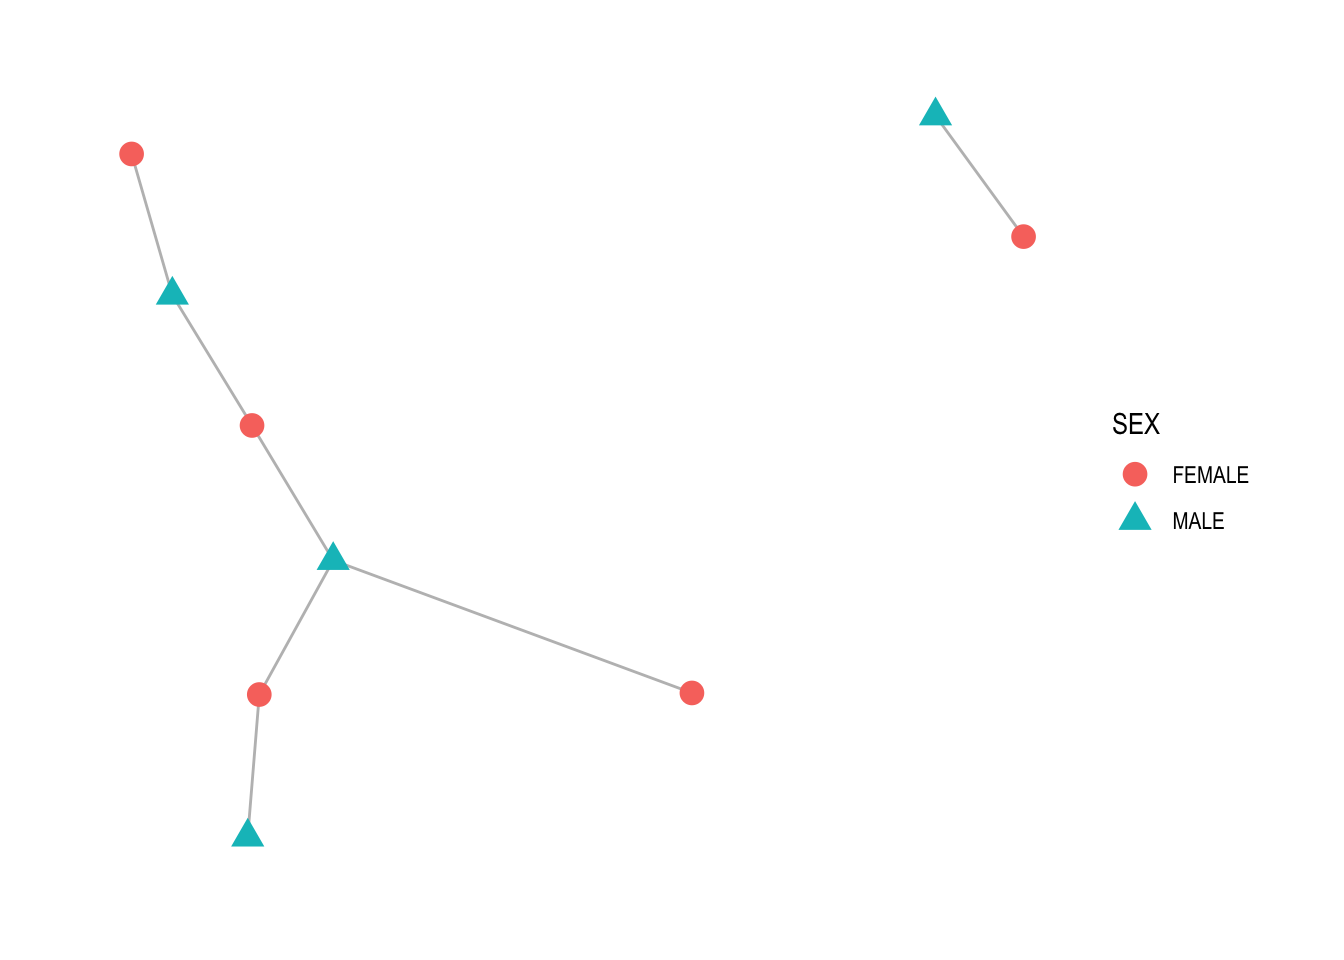
7.2 Node labels
ggraph(lemur, layout = "kk") +
  geom_edge_link(colour = "grey") +
  geom_node_point(aes(colour = SEX), size = 10) +
  geom_node_text(aes(label = id), colour = "white") +
  theme_graph() +
  scale_colour_manual(values = c("#CC79A7", "#56B4E9"))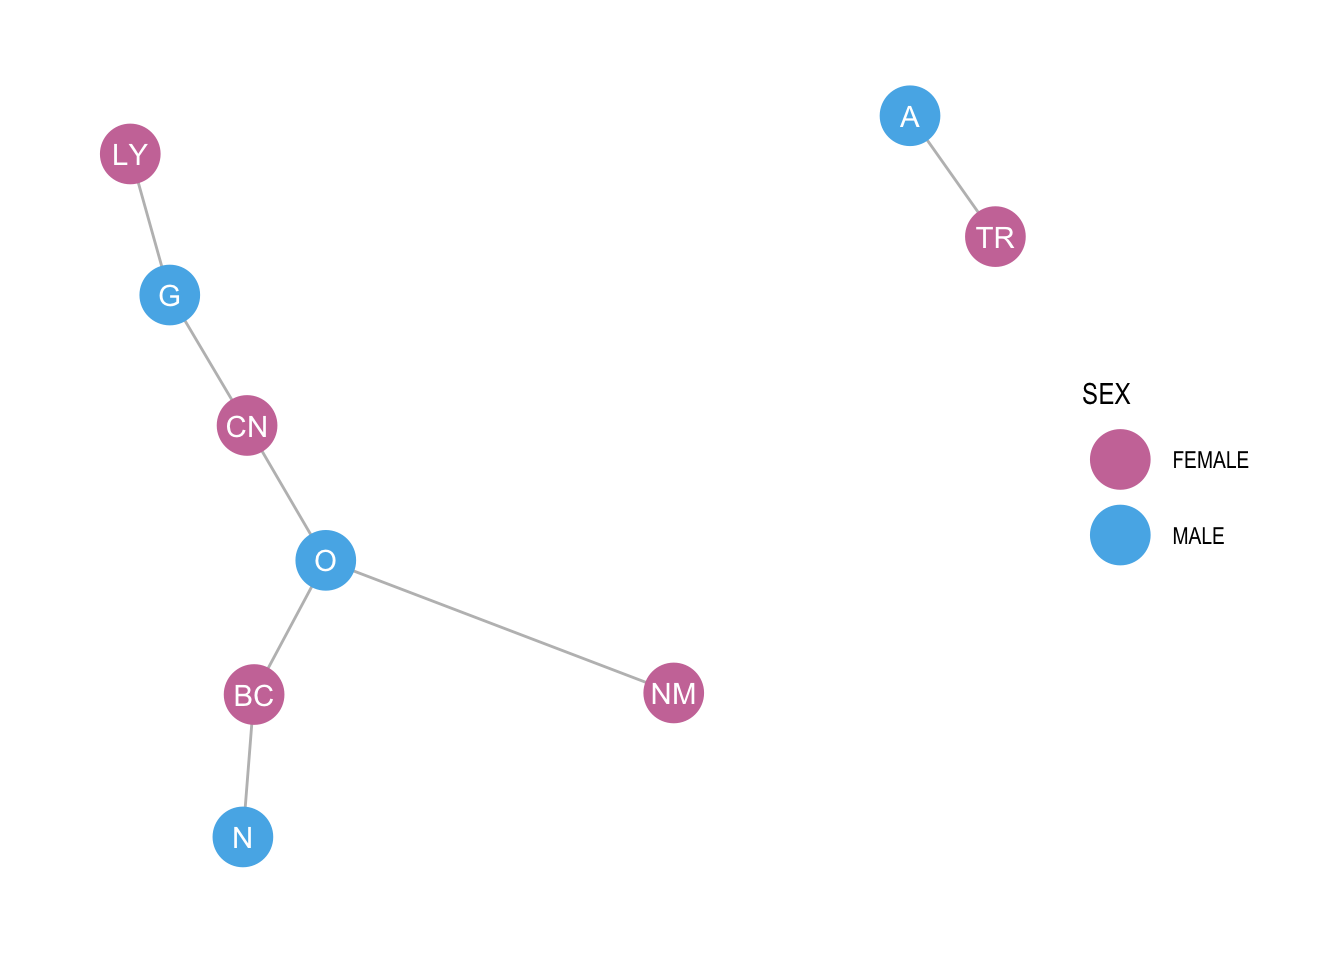
Different variant:
ggraph(lemur, layout = "kk") +
  geom_edge_link(colour = "grey") +
  geom_node_label(aes(fill = SEX, label = id), colour = "white") +
  theme_graph() +
  scale_colour_manual(values = c("#CC79A7", "#56B4E9"))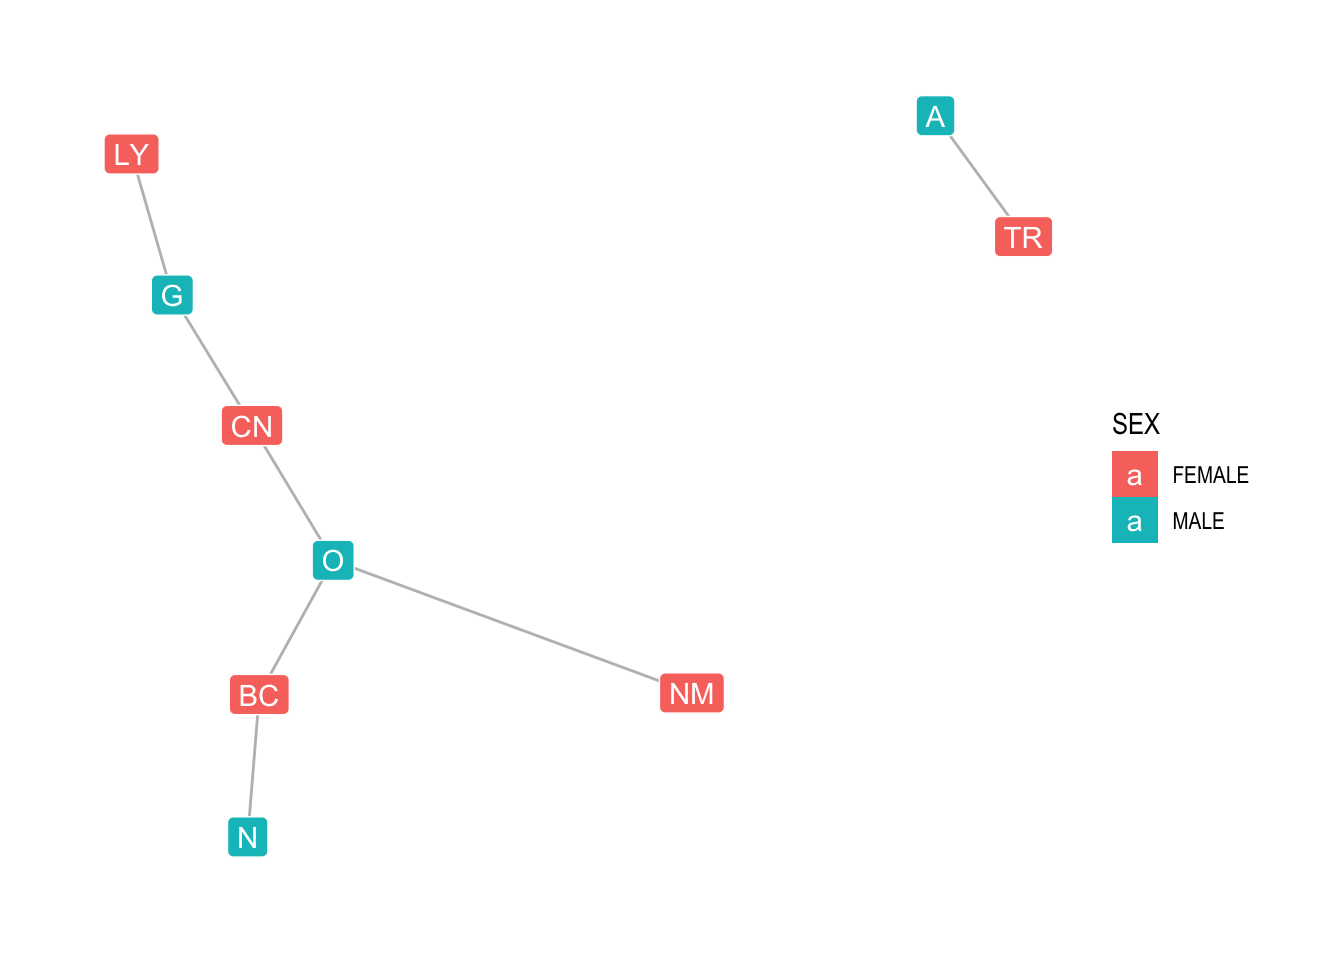
7.3 DIY
Try to make something fancy for the Zebras! Data from this wonderful website.
zebra_graphml <- read.graph("https://raw.githubusercontent.com/bansallab/asnr/master/Networks/Mammalia/zebra_groupmembership_weighted/zebra_sundaresan_interaction_attribute.graphml", format = "graphml")

zebra <- as_tbl_graph(zebra_graphml)