Titles, text and legends
Titles, subtitles, captions, and tags
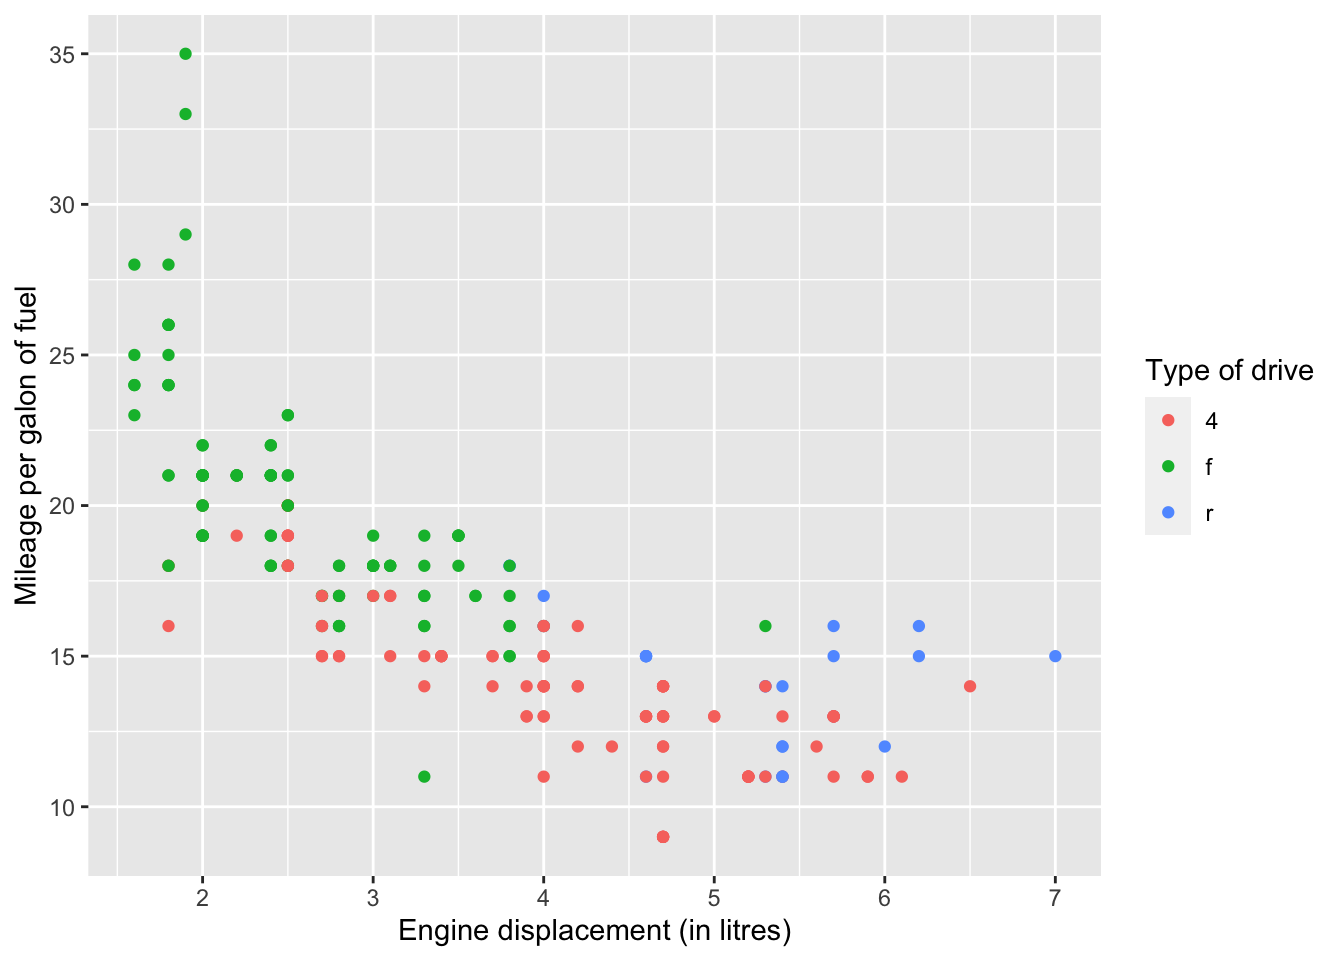
Including titles in ggplot is rather straightforward (whether they are plot-titles, axes-titles, or legend-titles). Let’s first change the axes-titles, and the legend-title:
ggplot(mpg, aes(x = displ, y = cty, colour = drv)) +
  geom_point() +
  labs(
    x = "Engine displacement (in litres)",
    y = "Mileage per galon of fuel",
    colour = "Type of drive"
  )
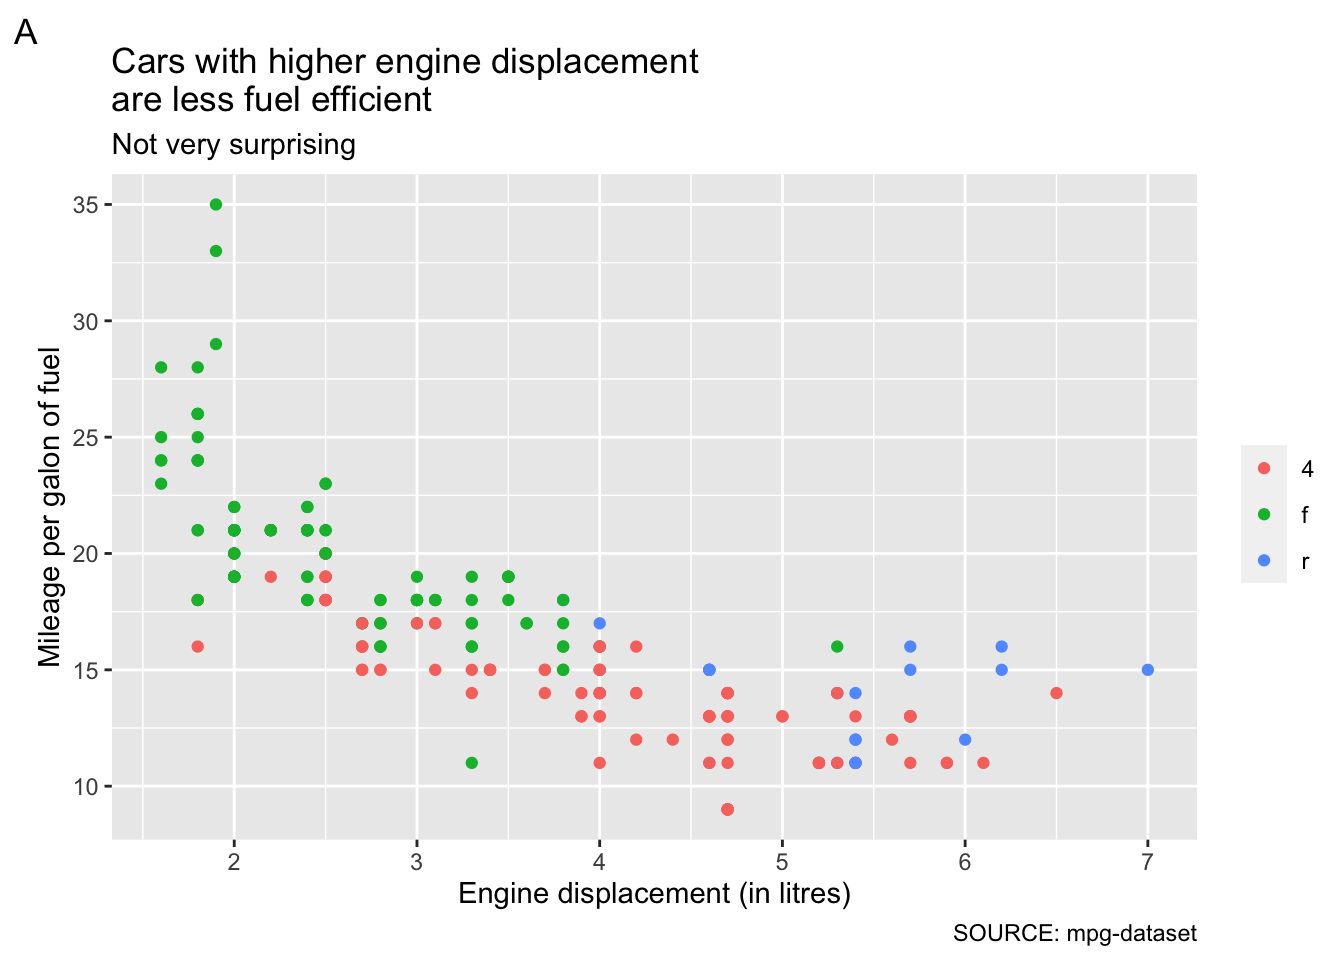
We can also add titles, subtitles, captions and tags to the plot.Let’s change some things (also including line-breaks) to get a better impression:
ggplot(mpg, aes(x = displ, y = cty, colour = drv)) +
  geom_point() +
  labs(
    x = "Engine displacement (in litres)",
    y = "Mileage per galon of fuel",
    title = "Cars with higher engine displacement\nare less fuel efficient",
    subtitle = "Not very surprising",
    caption = "SOURCE: mpg-dataset",
    tag = "A",
    colour = NULL
  )
Font, font size, emphasis
We can change aspects of the text (e.g., size, font, bold/italics) using theme. However, using different fonts in R is a bit of a hassle. You probably would like to make use of the extrafont package (follow the steps described here)
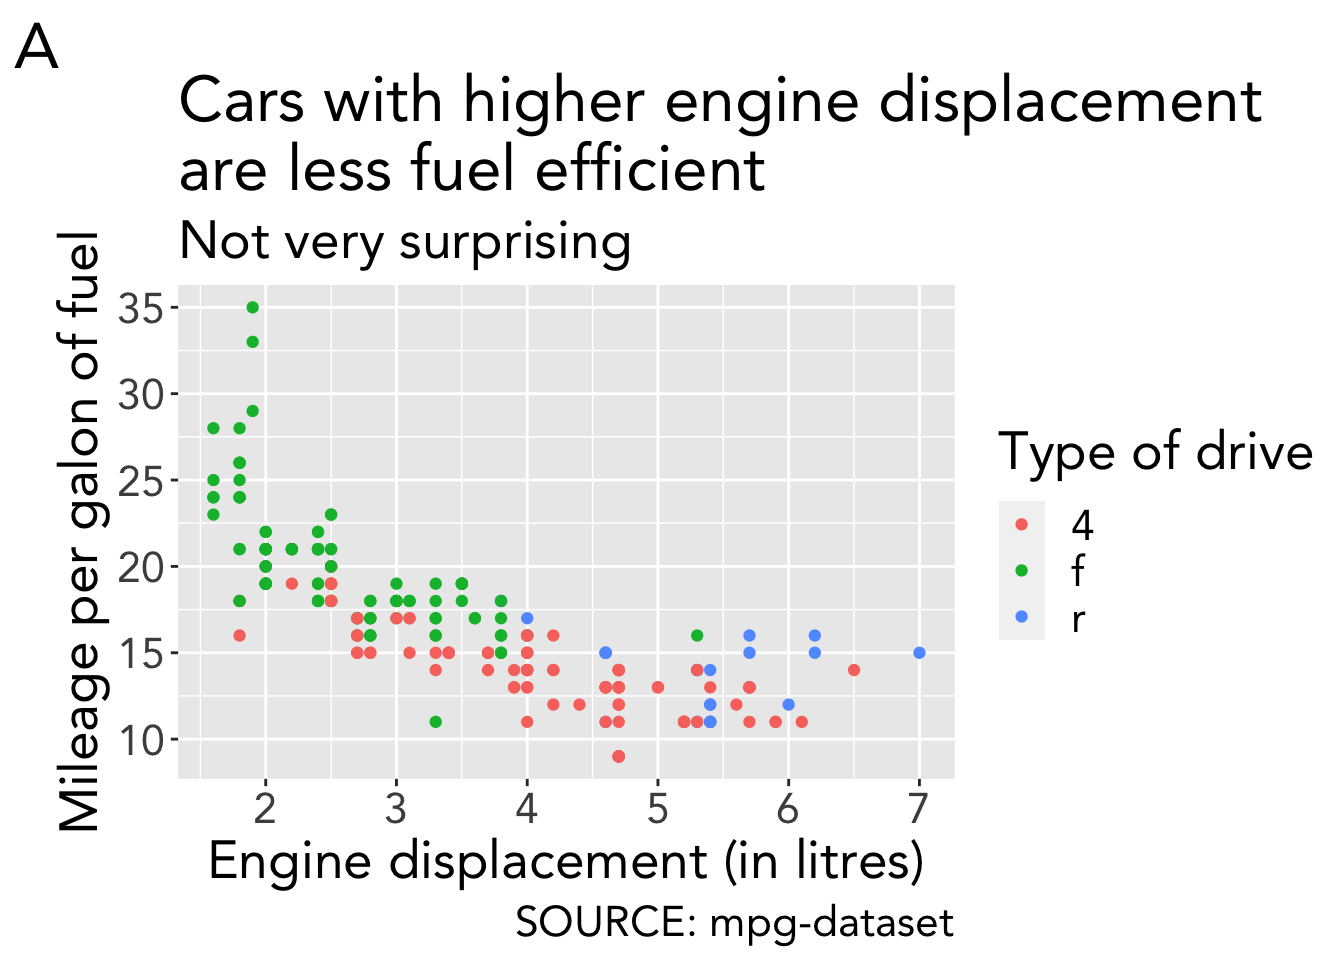
Let’s see some examples:
ggplot(mpg, aes(x = displ, y = cty, colour = drv)) +
  geom_point() +
  labs(
    x = "Engine displacement (in litres)",
    y = "Mileage per galon of fuel",
    title = "Cars with higher engine displacement\nare less fuel efficient",
    subtitle = "Not very surprising",
    caption = "SOURCE: mpg-dataset",
    tag = "A",
    colour = "Type of drive"
  ) +
  theme(
    text = element_text(size = 20, family = "Avenir") # changes all text
) 
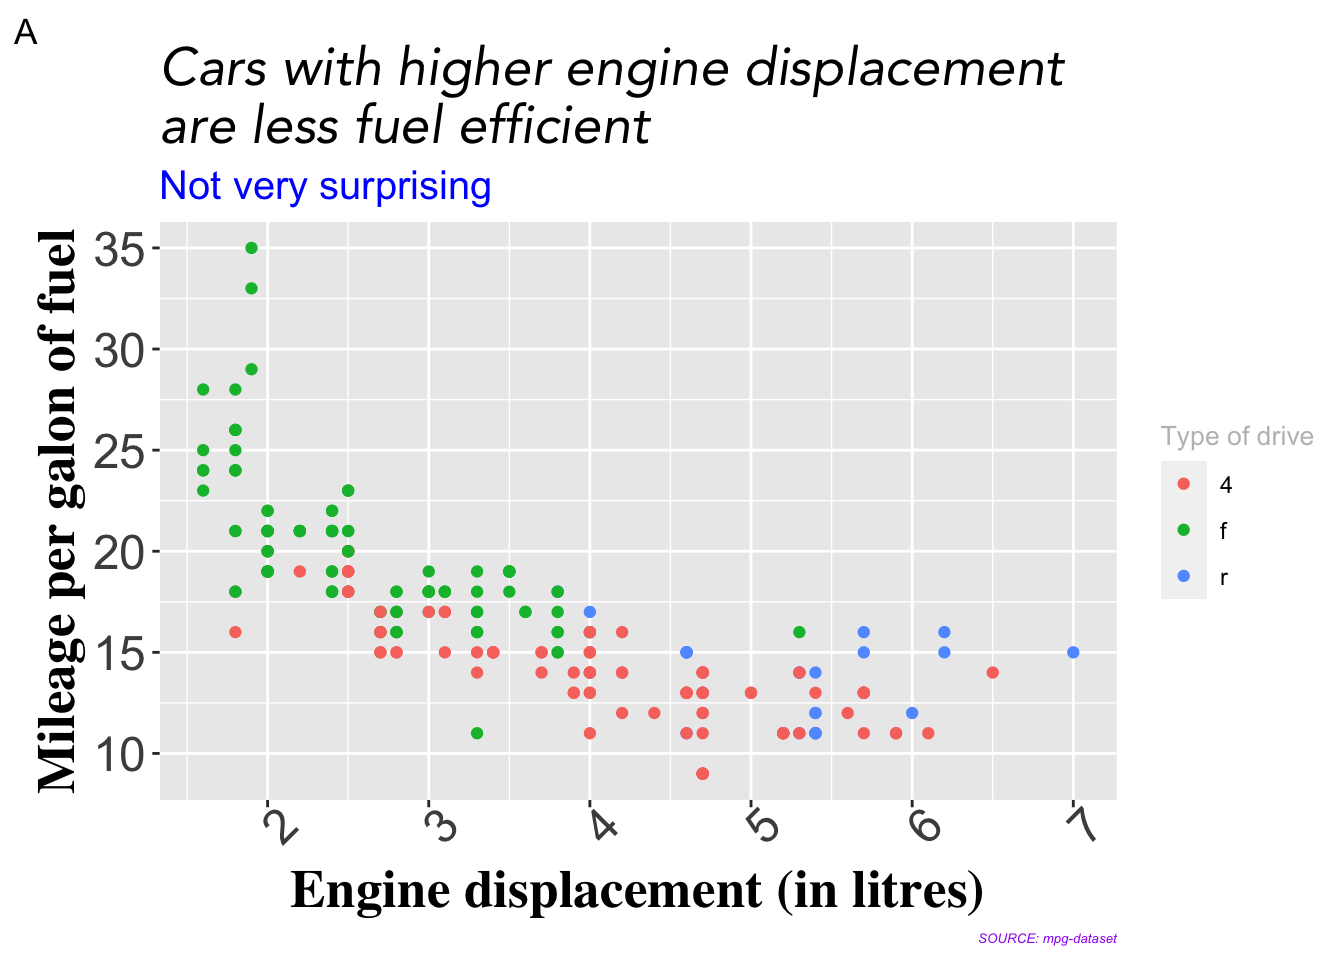
We can also change the text for each element of the graph:
ggplot(mpg, aes(x = displ, y = cty, colour = drv)) +
  geom_point() +
  labs(
    x = "Engine displacement (in litres)",
    y = "Mileage per galon of fuel",
    title = "Cars with higher engine displacement\nare less fuel efficient",
    subtitle = "Not very surprising",
    caption = "SOURCE: mpg-dataset",
    tag = "A",
    colour = "Type of drive"
  ) +
  theme(
    axis.text = element_text(size = 18),
    axis.text.x = element_text(angle = 45),
    axis.title = element_text(size = 20, family = "Times", face = "bold"),
    plot.title = element_text(size = 20, family = "Avenir", face = "italic"),
    plot.subtitle = element_text(size = 15, colour = "blue"),
    plot.caption = element_text(size = 5, colour = "purple", face = "italic"),
    legend.title = element_text(size = 10, colour = "grey")
  )