Assignment 5
Preparation
Download this Rmarkdown file, fill in your name and student number, and complete your assignment in the Rmarkdown file. “knit” your text and code into a pdf-file, and upload this pdf-file on Brightspace before the next lecture. Make sure that your pdf-output looks correct.
Visualization
The dataset that we’ll use comes from one of the articles of the awesome website fivethirtyeight. A beautiful feature of this website is that all data underlying the articles are open for readers to verify: https://github.com/fivethirtyeight/data. Here, we’ll focus on the article What Do Men Think It Means To Be A Man?. Read the article and look closely at the visualisation with the title “Do you think that society puts pressure on men in a way that is unhealthy or bad for them?”:
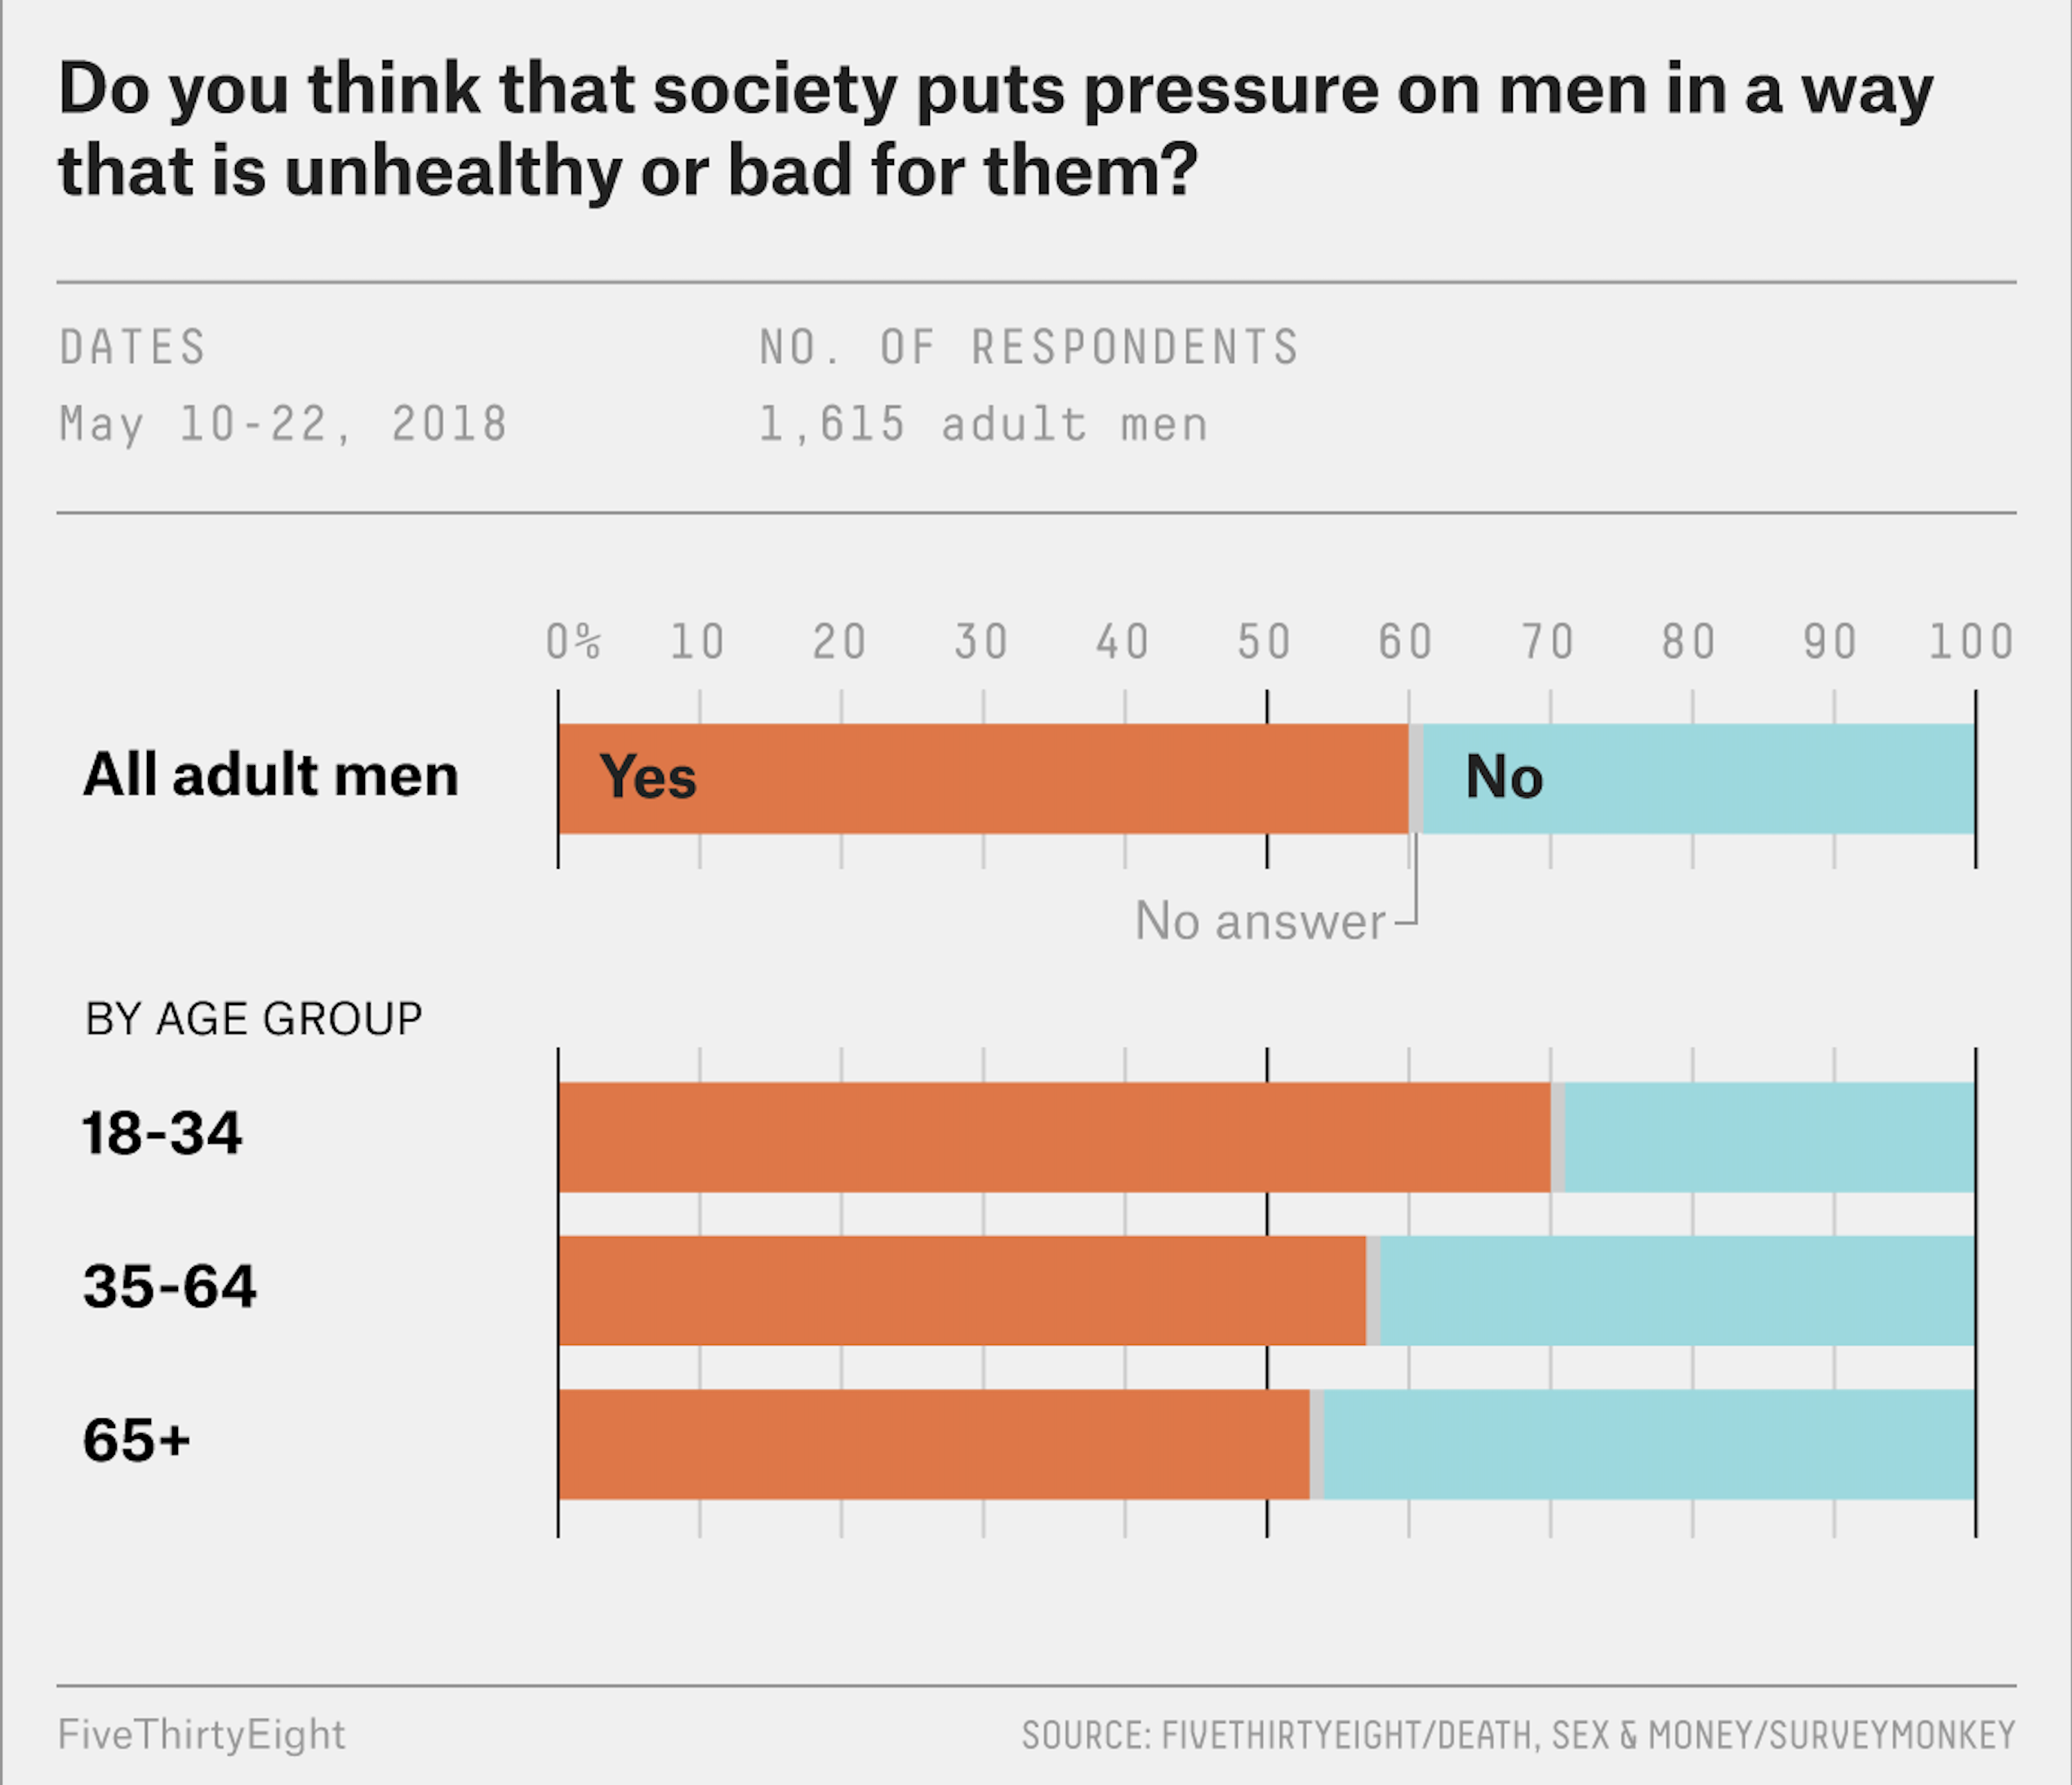
The assignment is to try and recreate this graph as closely as possible.
Packages & Data
The below code will download the survey-data and select two columns from the survey:
q0005: this variable gives the answers to the question: “Do you think that society puts pressure on men in a way that is unhealthy or bad for them?”. Possible answers are:yes/no/no answerage3: this variable stores the age of the respondent in three categories,18 - 34/35 - 64/65 and up
library(ggplot2)
library(tidyverse)

data  <- read_csv(
  "https://raw.githubusercontent.com/fivethirtyeight/data/master/masculinity-survey/raw-responses.csv",
  col_names = TRUE) %>%
  select(q0005, age3)
table(data$q0005)
##
## No No answer Yes
## 647 13 955##
## 18 - 34 35 - 64 65 and up
## 133 855 627Your task
Part I
Try to recreate the first graph in the article as closely as possible.
You will probably need the package
patchworkorcowplotto combine graphs.You can make use of the package
ggthemesbut you don’t have to.Explain in no more than 250 words what the graph is showing. Also reflect on anything surprising that you may have encountered in creating the graph.
Part II
Read-in the entire dataset, pick any variables that you are interested in, and create a beautiful or extravagant visualisation.
You can find out here what the variables entail.
Submit your PDF-file online
When you are done with your assignment, try clicking the “Knit”-button in Rstudio so that your code will be knitted into a pdf-file. Submit this file on Brightspace.
If you see an error appear, try to fix the error and try again. If you can’t get the “knitting” to work, then you can copy your code, text, and graphs into a word-file and submit it on Brightspace.