Chapter 16 Revisiting earlier graphs 2
In this section, we’ll revisit earlier graphs (and make some new ones), and we’ll change some features of those graphs. Particularly, we’ll focus on changing scales and colours, and we’ll look at facets again.
16.1 scales
Read the section Scales, Axes & Coordinate systems.
Let’s put it to good use.
16.1.1 log-transformation
## `stat_bin()` using `bins = 30`. Pick
## better value with `binwidth`.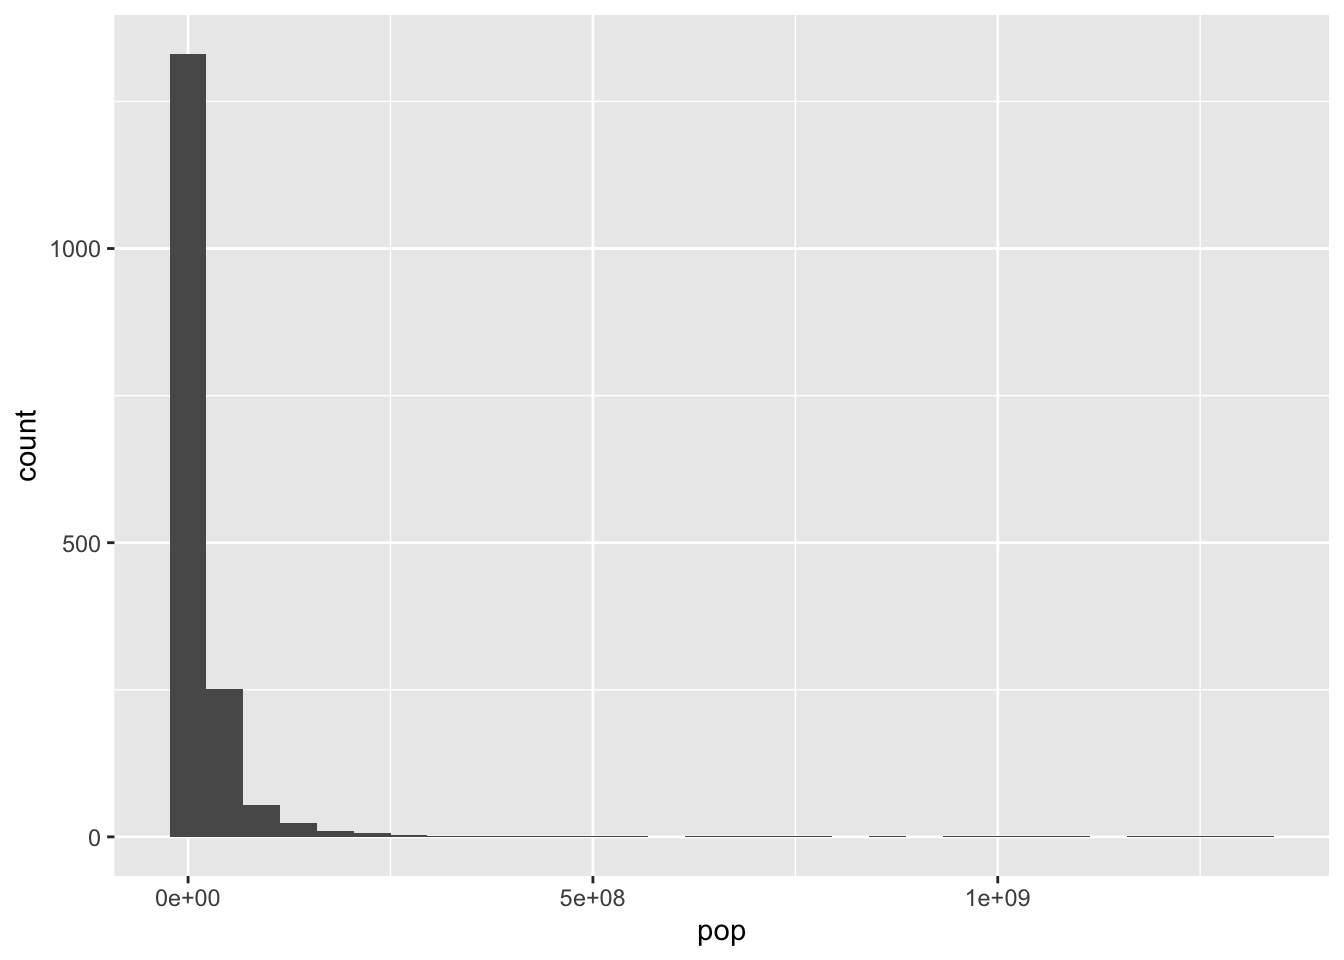
## `stat_bin()` using `bins = 30`. Pick
## better value with `binwidth`.
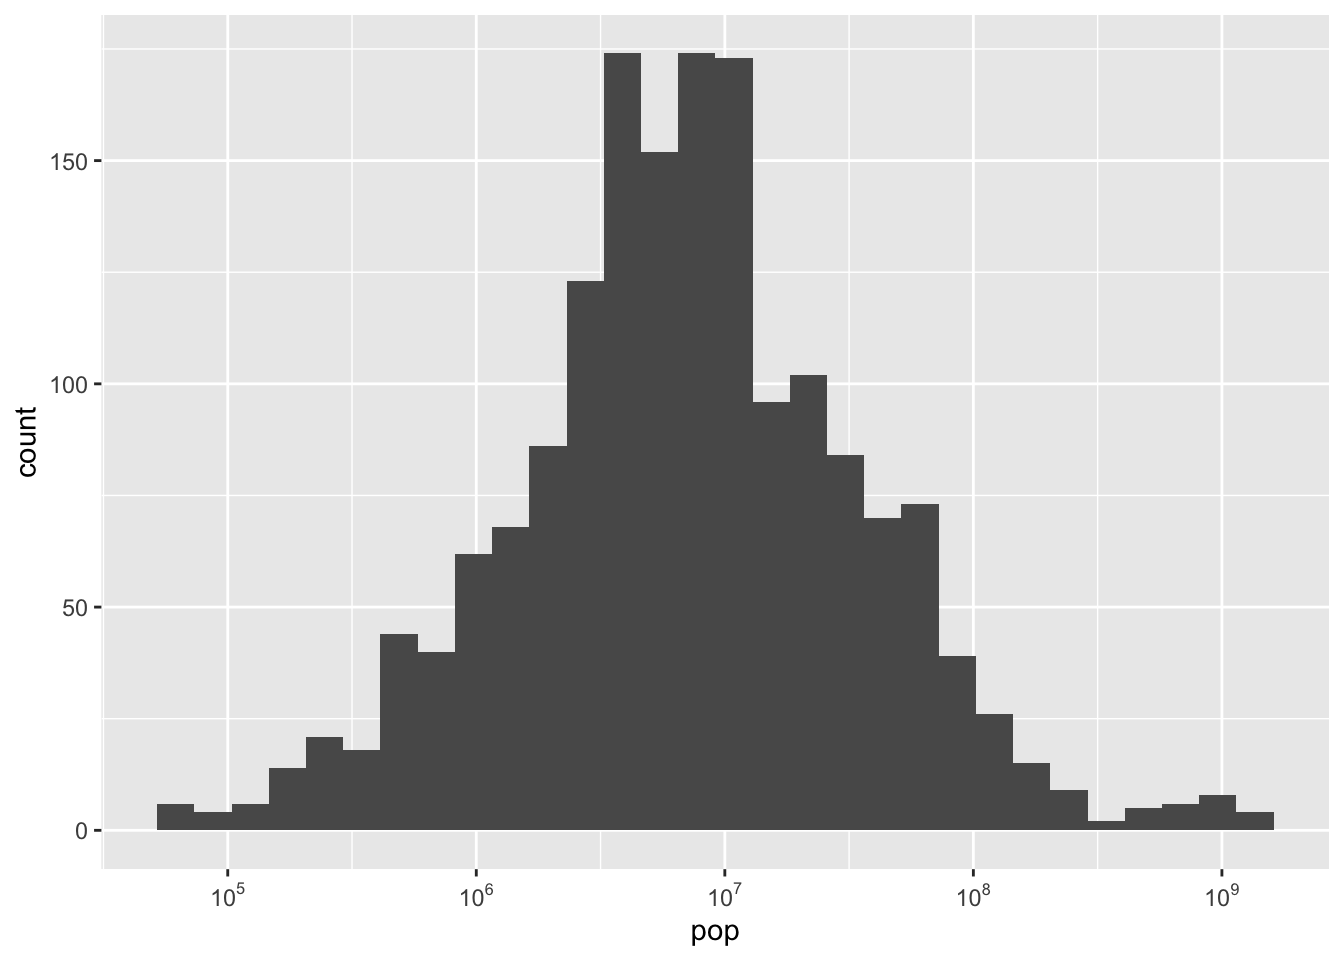
Let’s go further:
library(scales)
ggplot(gapminder, aes(x = pop)) +
  geom_histogram() +
  scale_x_continuous(
    trans = "log10",
    labels = trans_format("log10", math_format(10^.x))
  )
16.2 colours
Read the section colours.
Let’s add a palette from RColourBrewer:
Let’s try again:
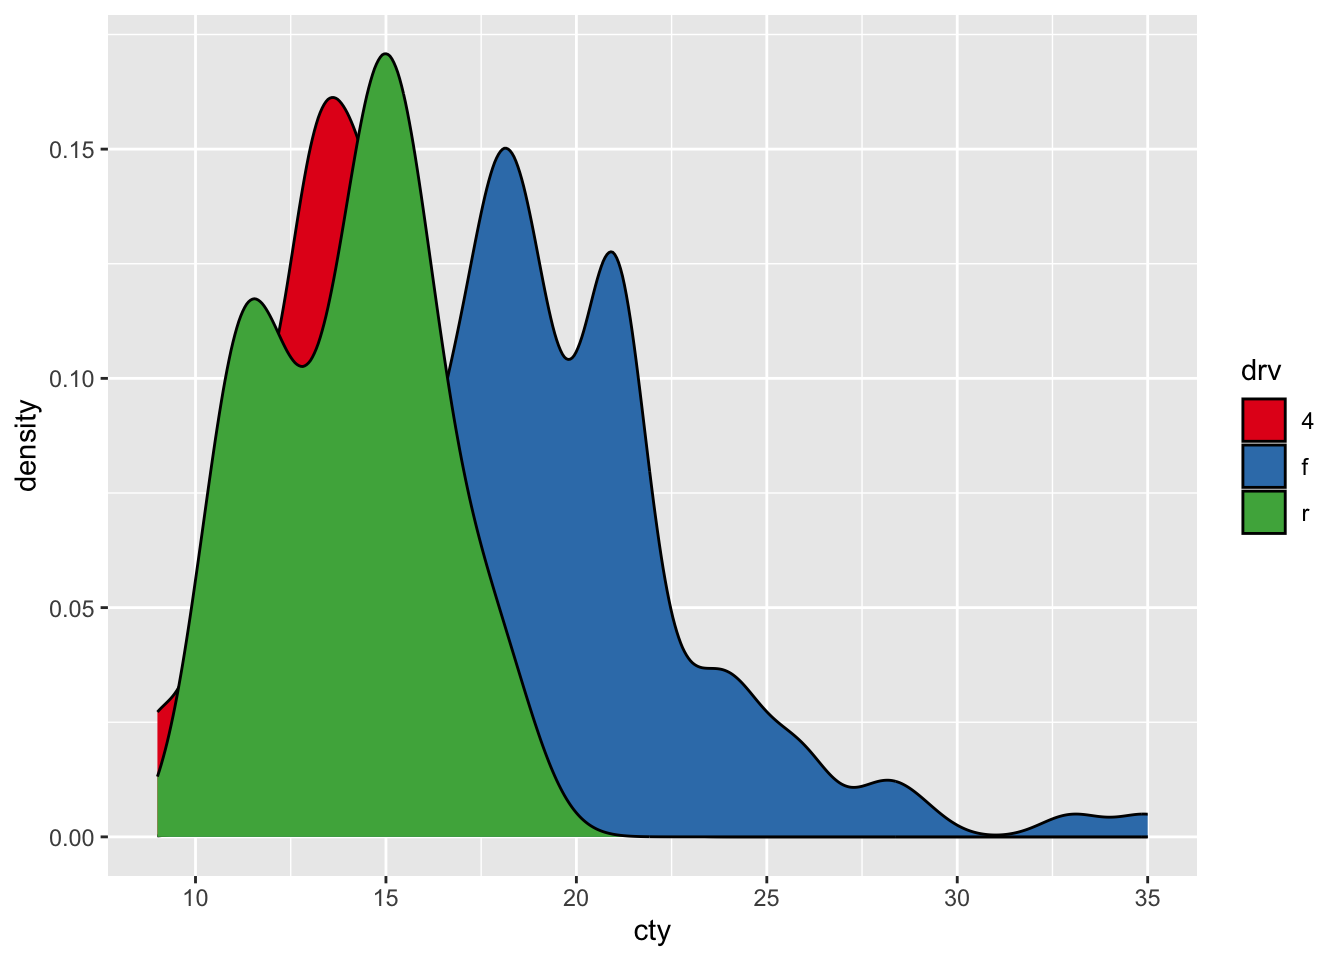
ggplot(mpg, aes(x = cty, fill = manufacturer)) +
  geom_density() +
  scale_fill_brewer(palette = "Set1")
## Warning in RColorBrewer::brewer.pal(n, pal): n too large, allowed maximum for palette Set1 is 9
## Returning the palette you asked for with that many colors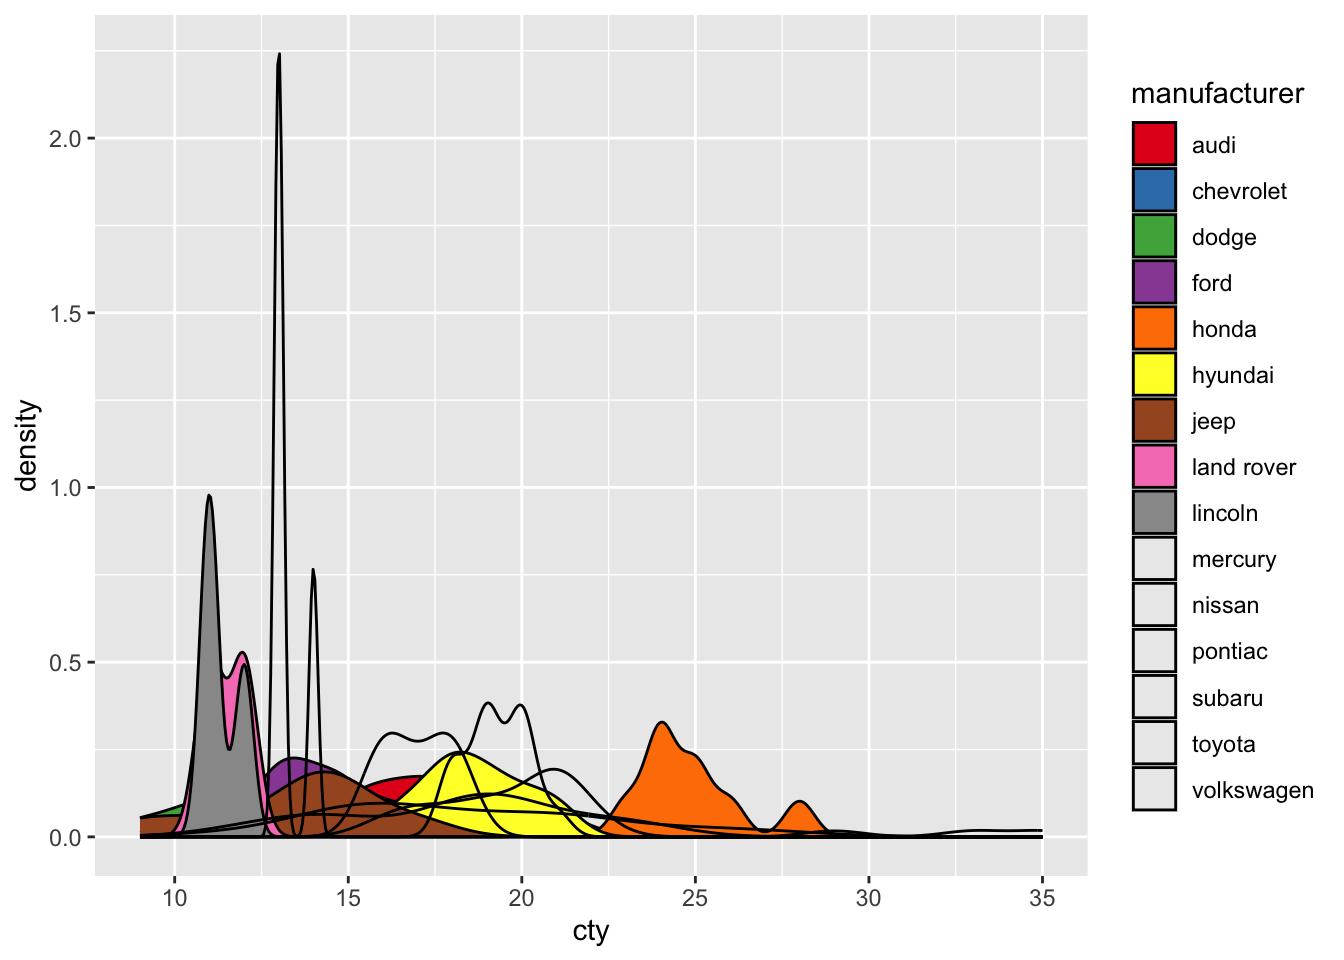
What’s going on here?
Let’s see another example:
ggplot(mpg, aes(x = displ, y = cty, colour = drv)) +
  geom_point() +
  geom_smooth(method = "lm", se = FALSE) +
  scale_colour_brewer(palette = "Set2")
## `geom_smooth()` using formula = 'y ~
## x'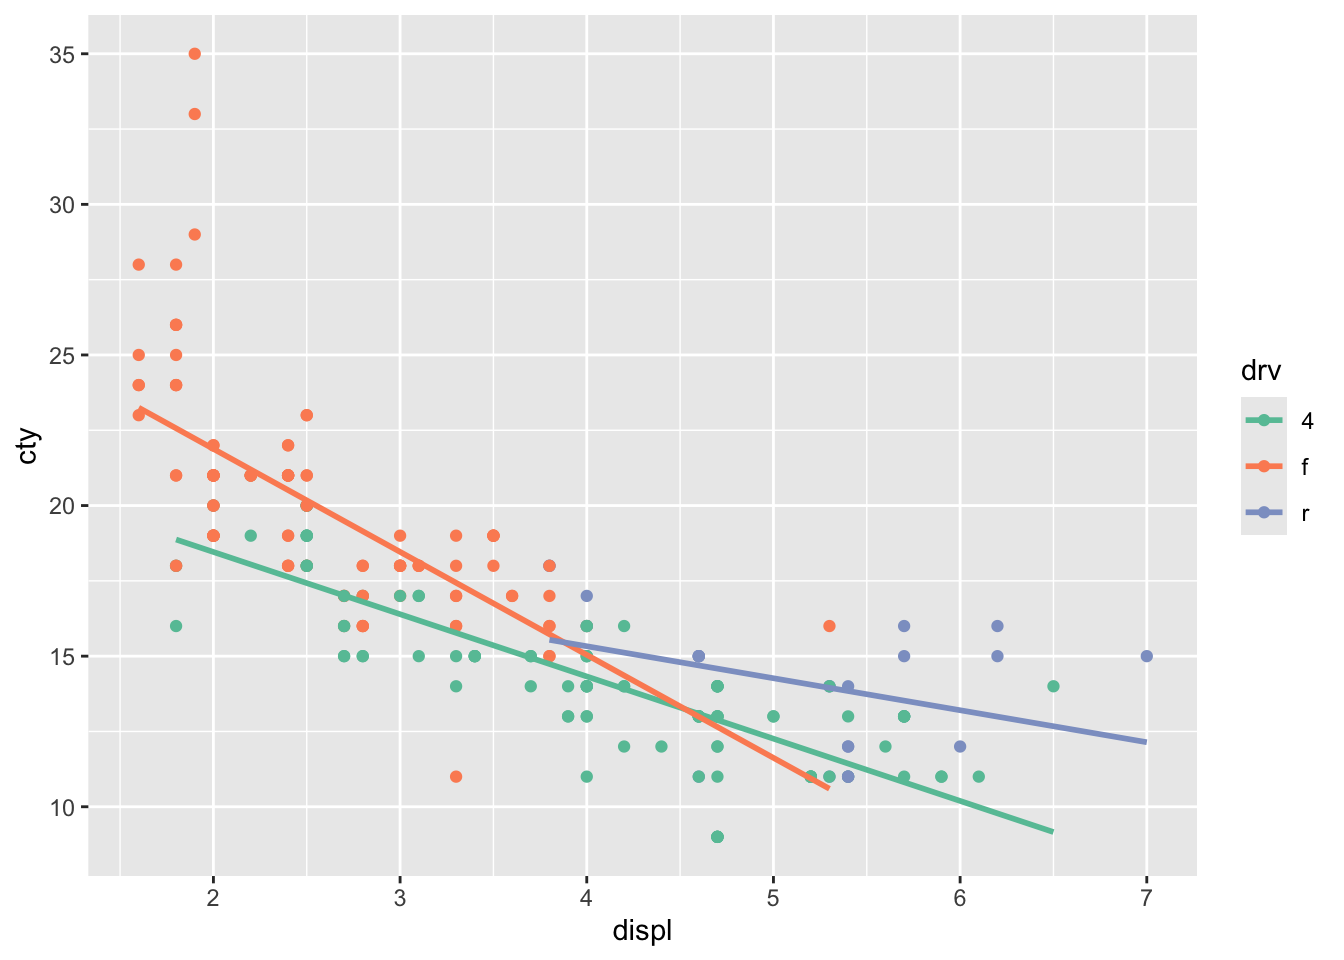
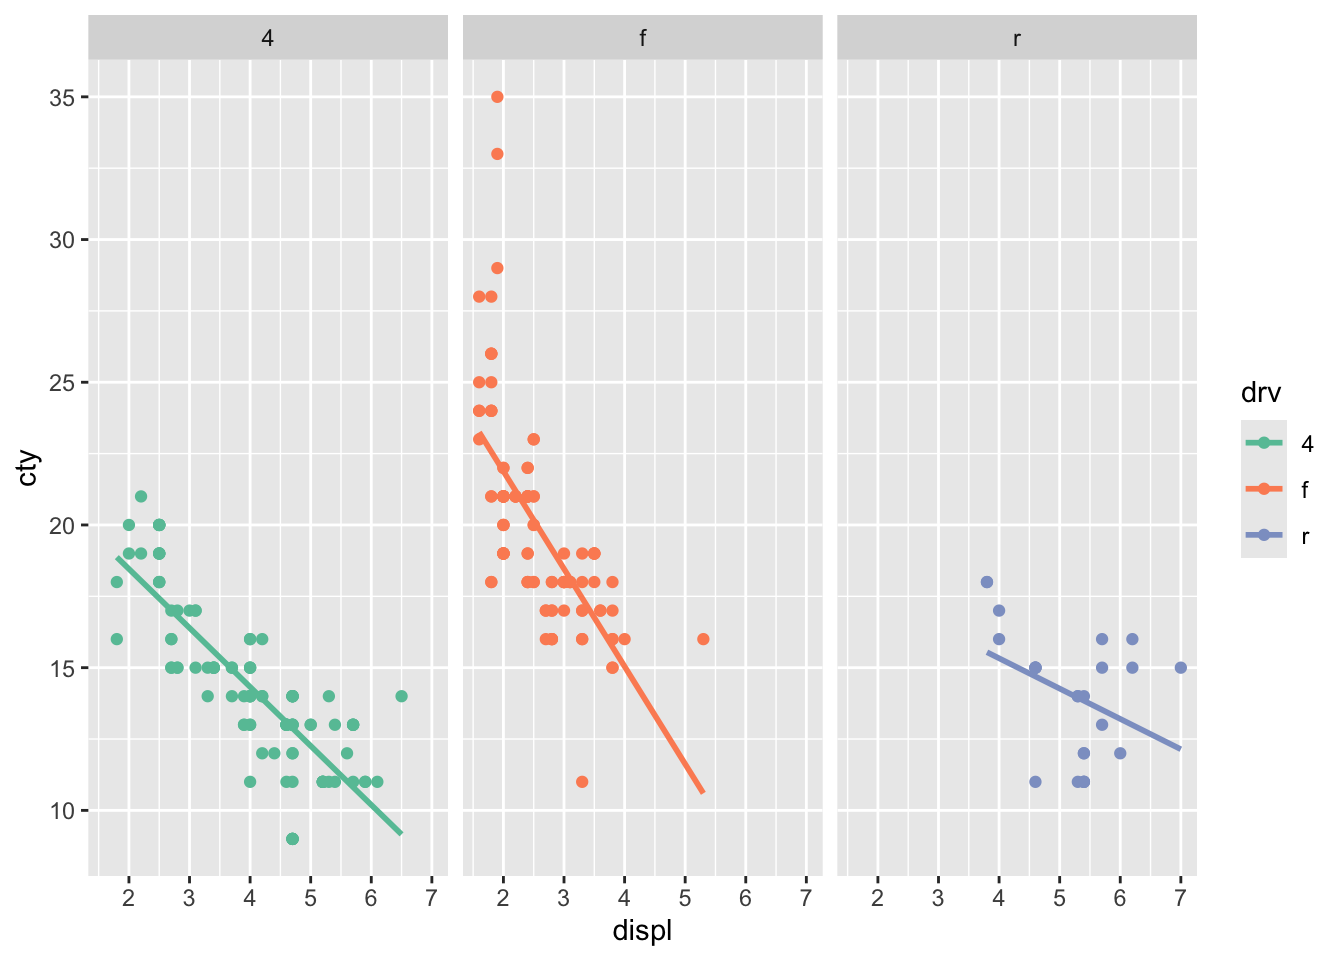
16.3 facets
Read the section Facets.
Example:
ggplot(mpg, aes(x = displ, y = cty, colour = drv)) +
  geom_point() +
  geom_smooth(method = "lm", se = FALSE) +
  scale_colour_brewer(palette = "Set2") +
  facet_grid(~ drv)
## `geom_smooth()` using formula = 'y ~
## x'