Chapter 9 Using extension packages
Many great extension packages exist for ggplot: https://exts.ggplot2.tidyverse.org/. These extend ggplot but use the same form of language that ggplot does. There are three packages that allow neat ways for comparing distributions: ggridges, gghalves, and ggforce. We’ll see sina-plots and cloud-and-rain plots along the way!
9.1 ggridges
Rather than explaining, let’s see what ggridges does (see also here). We have to install it first of course.
## Picking joint bandwidth of 0.929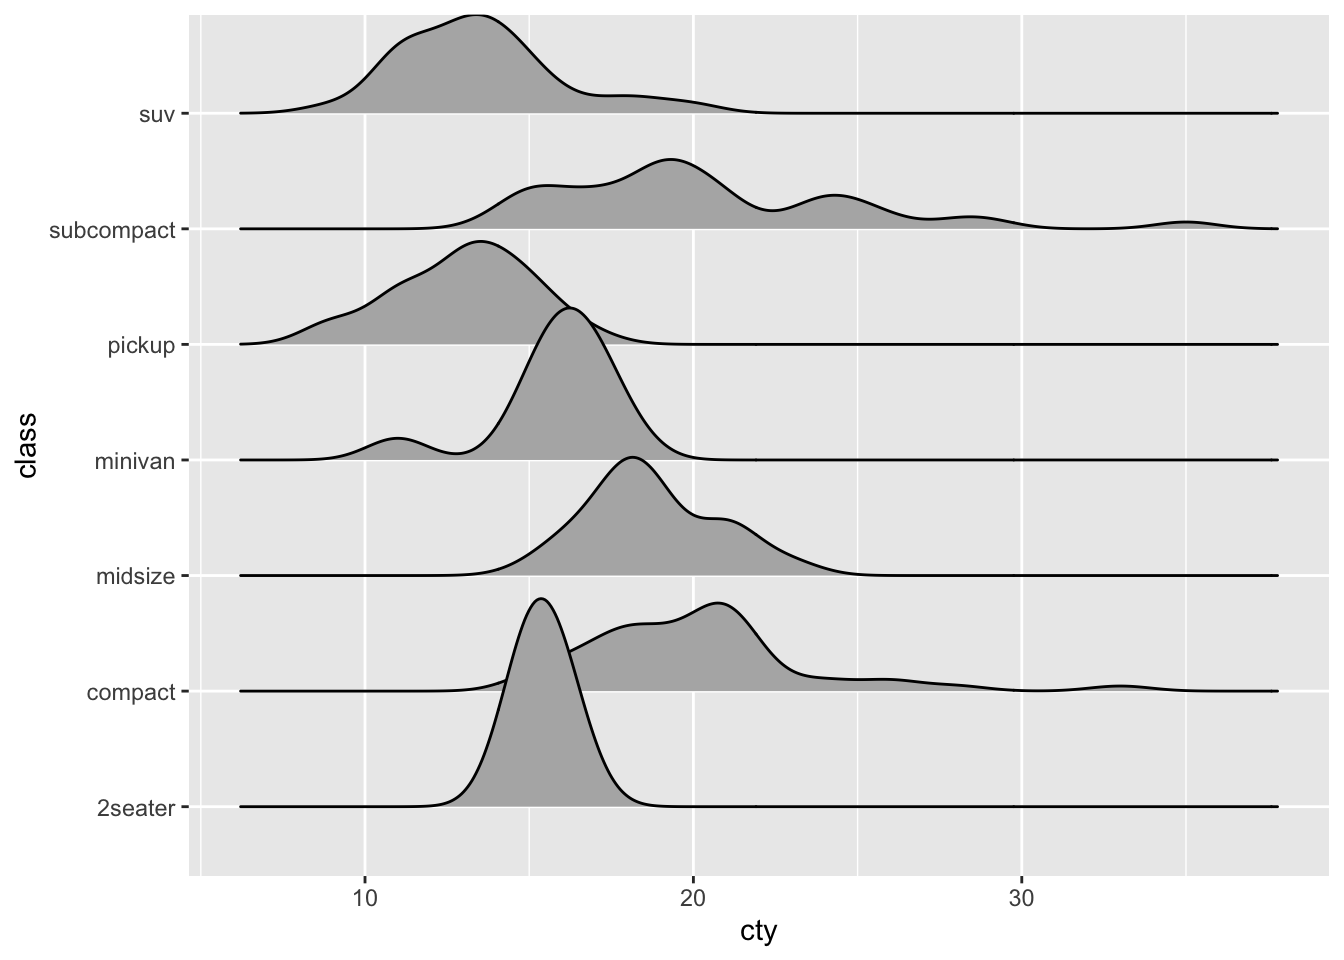
Let’s improve:
## Picking joint bandwidth of 0.929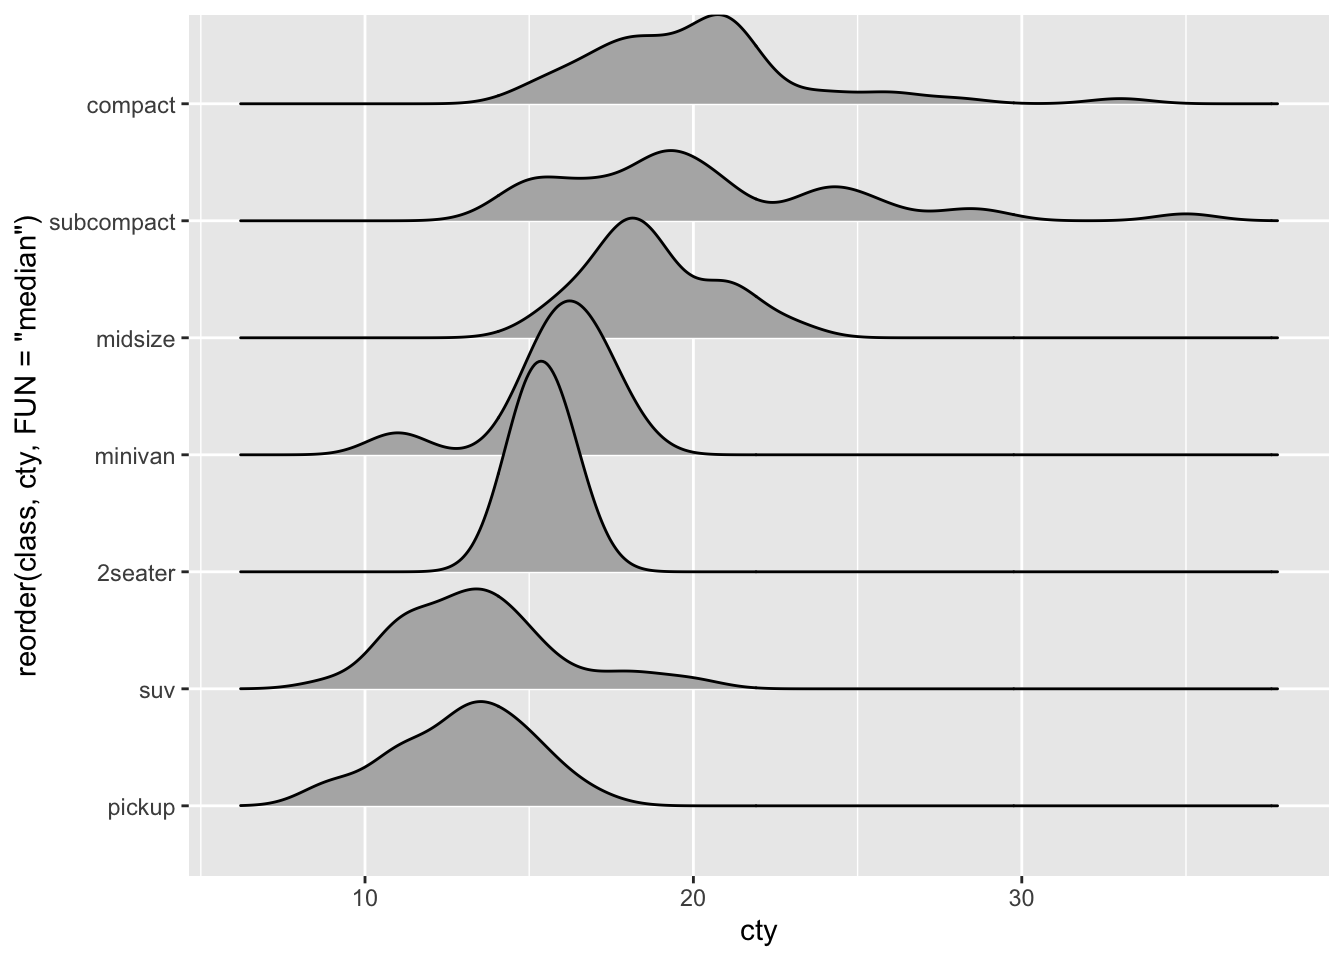
Let’s further improve:
ggplot(mpg, aes(x = cty, y = reorder(class, cty, FUN = "median"), fill = after_stat(x))) +
  geom_density_ridges_gradient()
## Picking joint bandwidth of 0.929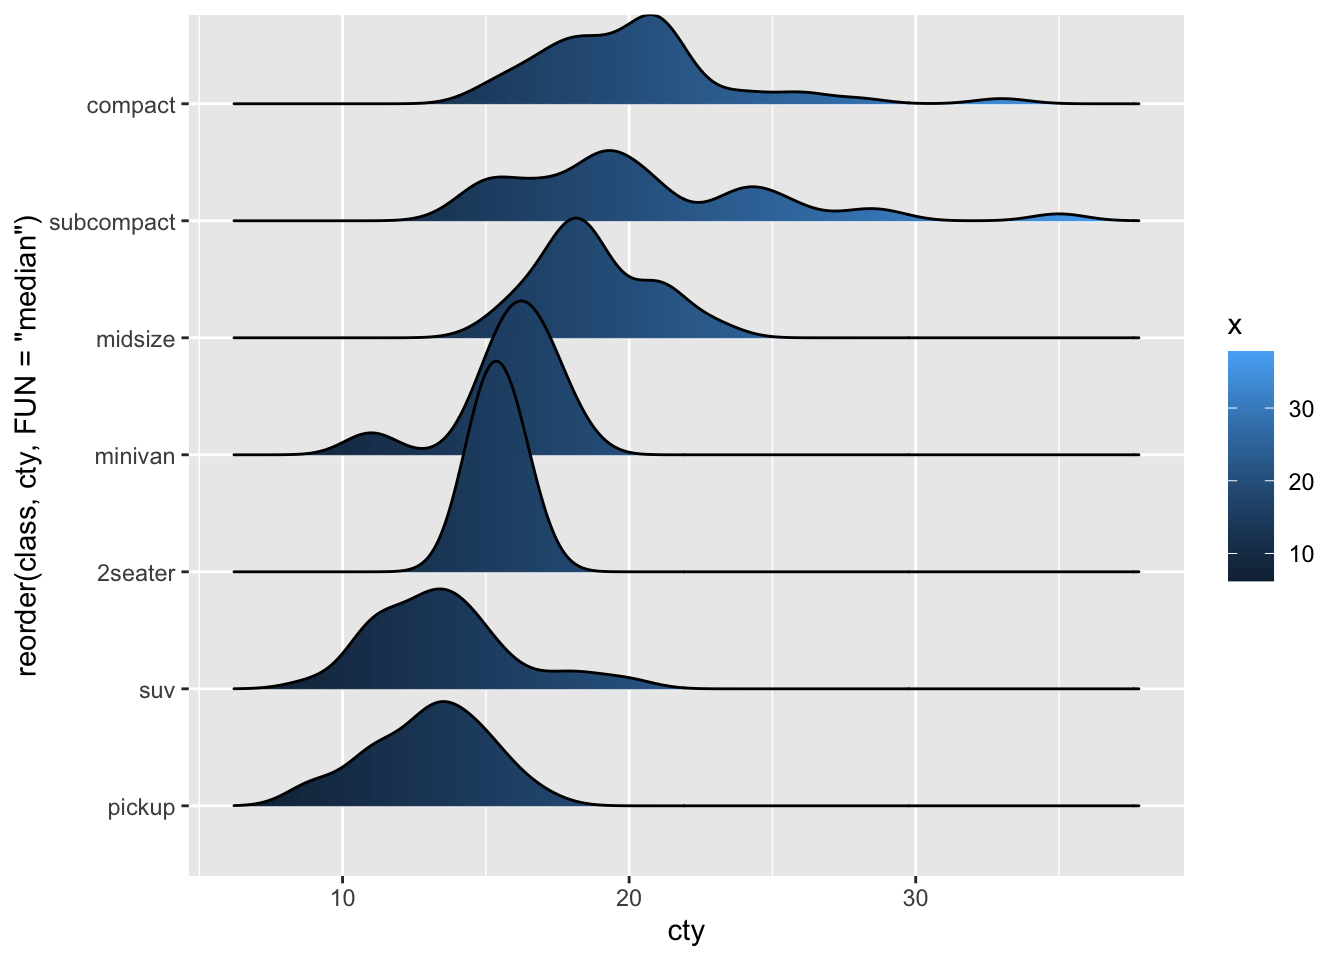
What has happened here?
9.2 gghalves
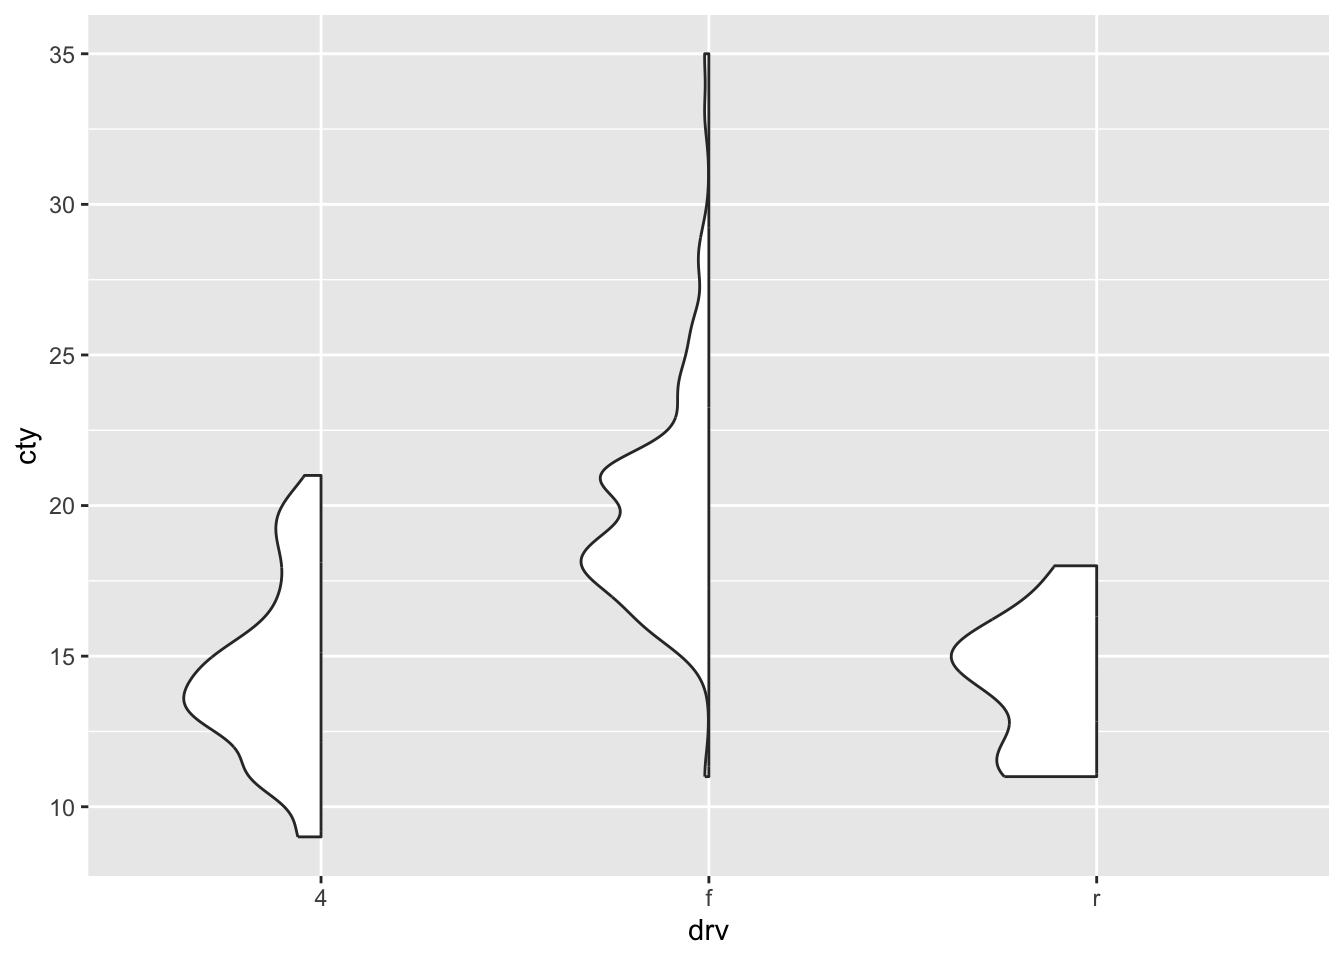
gghalves does more of the same of what we’ve seen but it allows multiple forms of visualization side by side, half-on-half (see also here. We have to install it first of course.
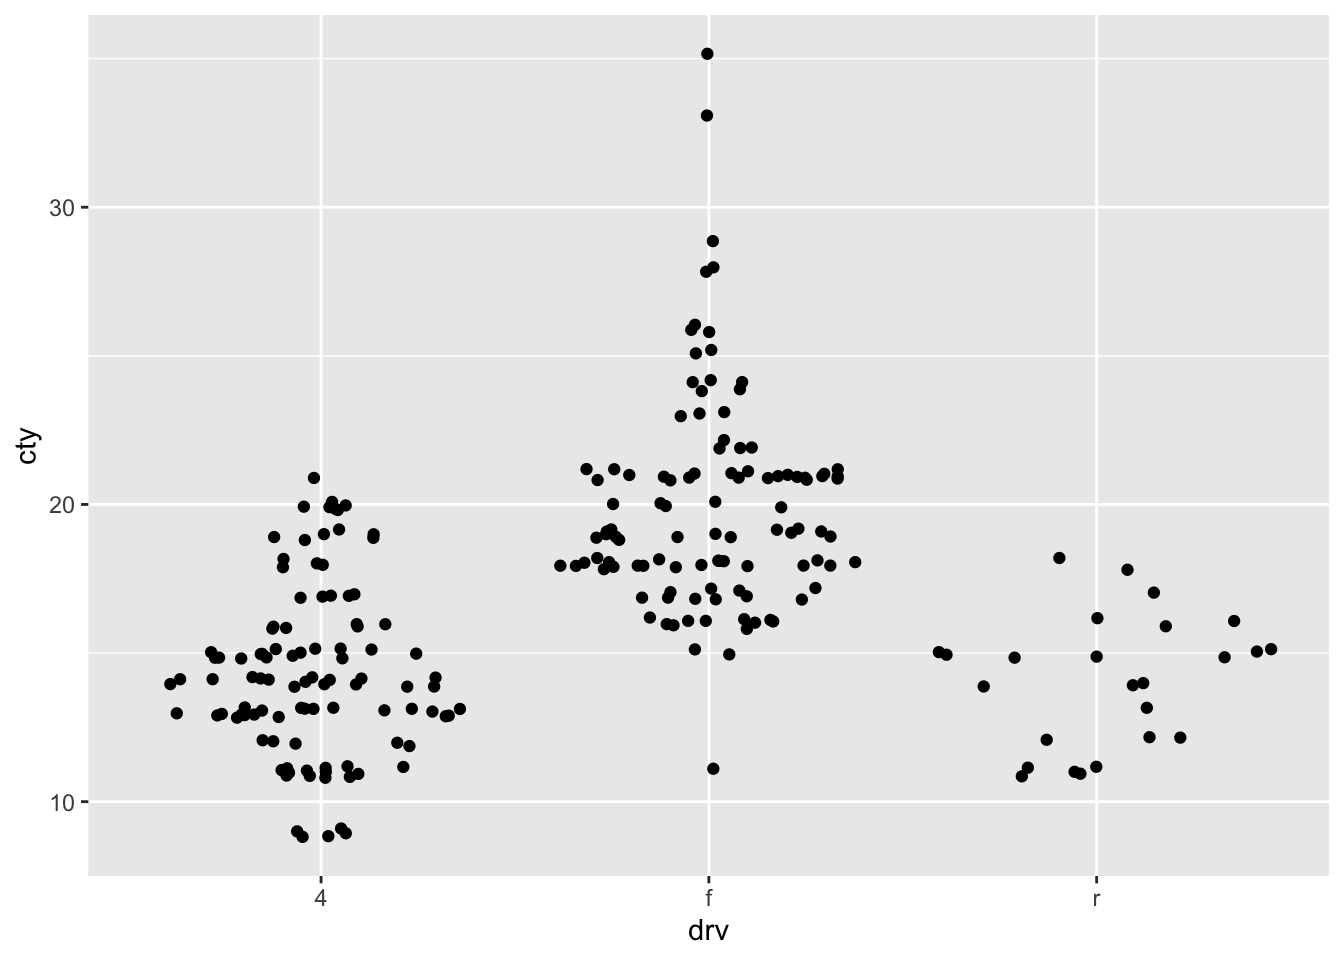
This package allows you to draw boxplots and violinplots (and more), but only half of them. In this way, you can combine them such that on the left there is another geom than on the right. Let’s see it in action:
Looks funky.
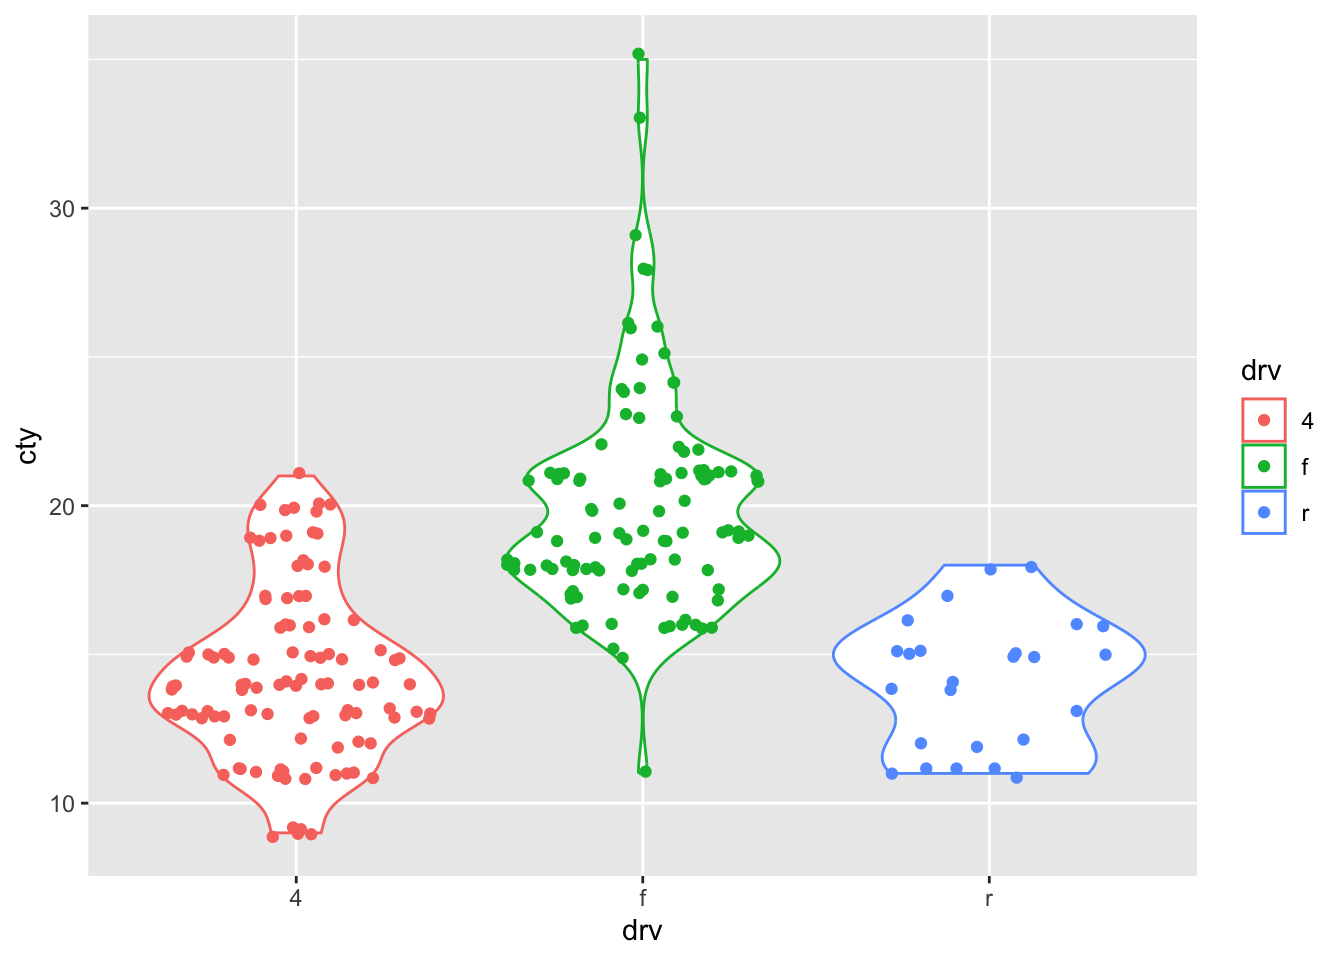
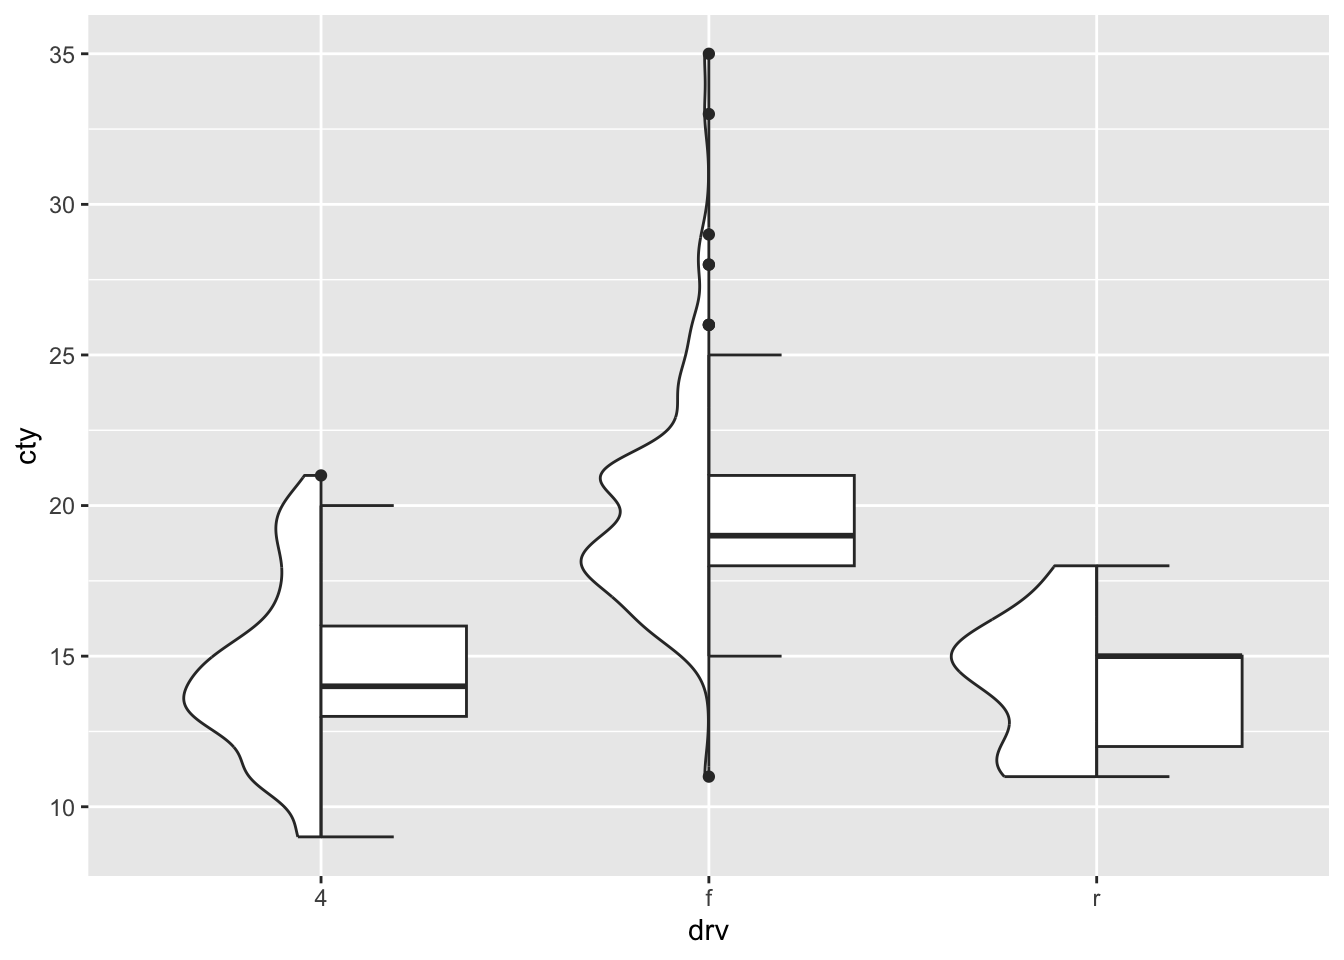
A different version:
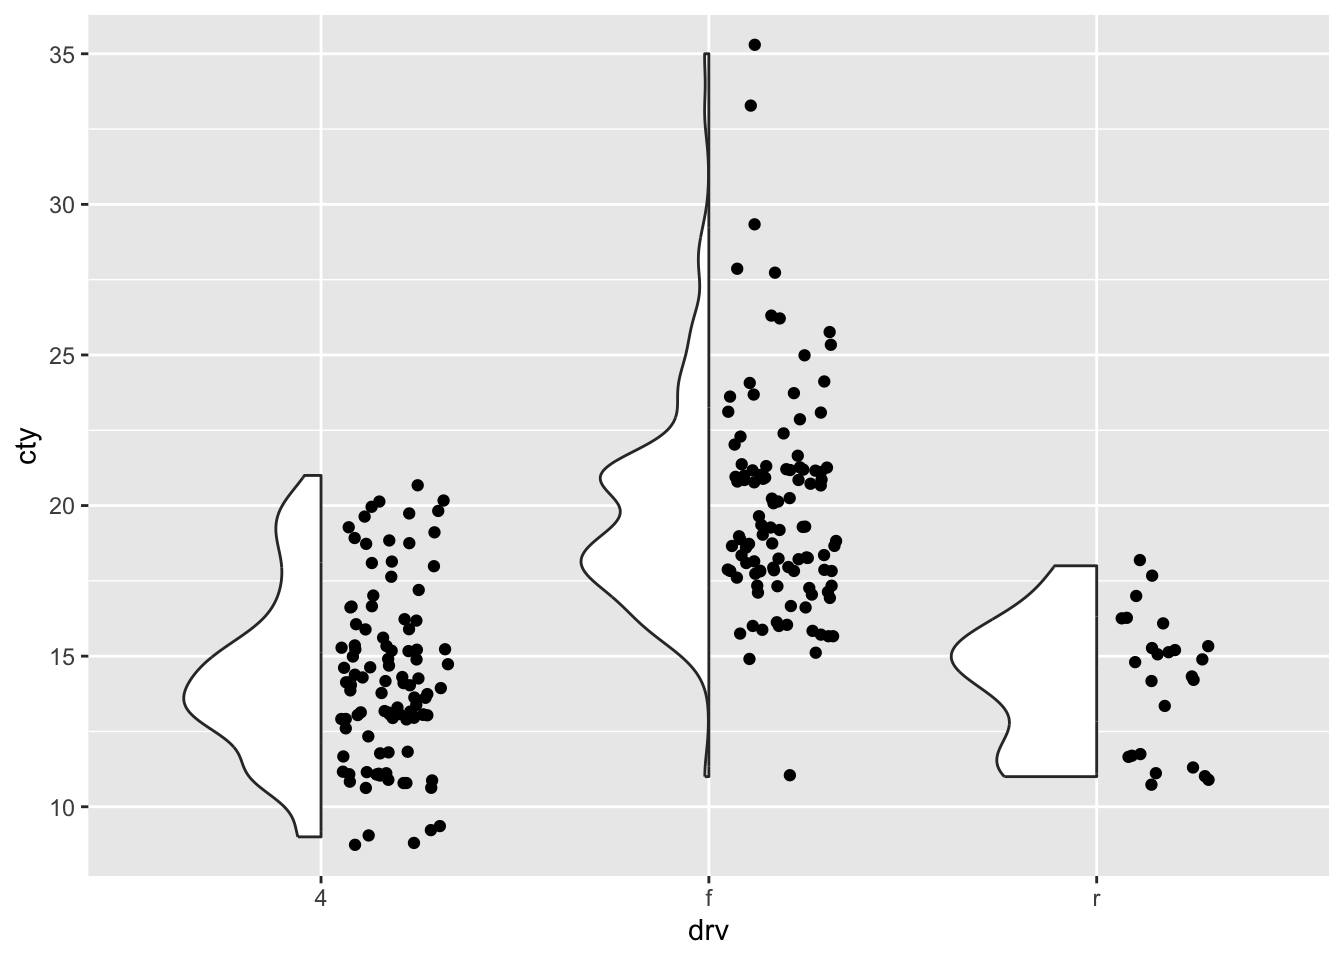
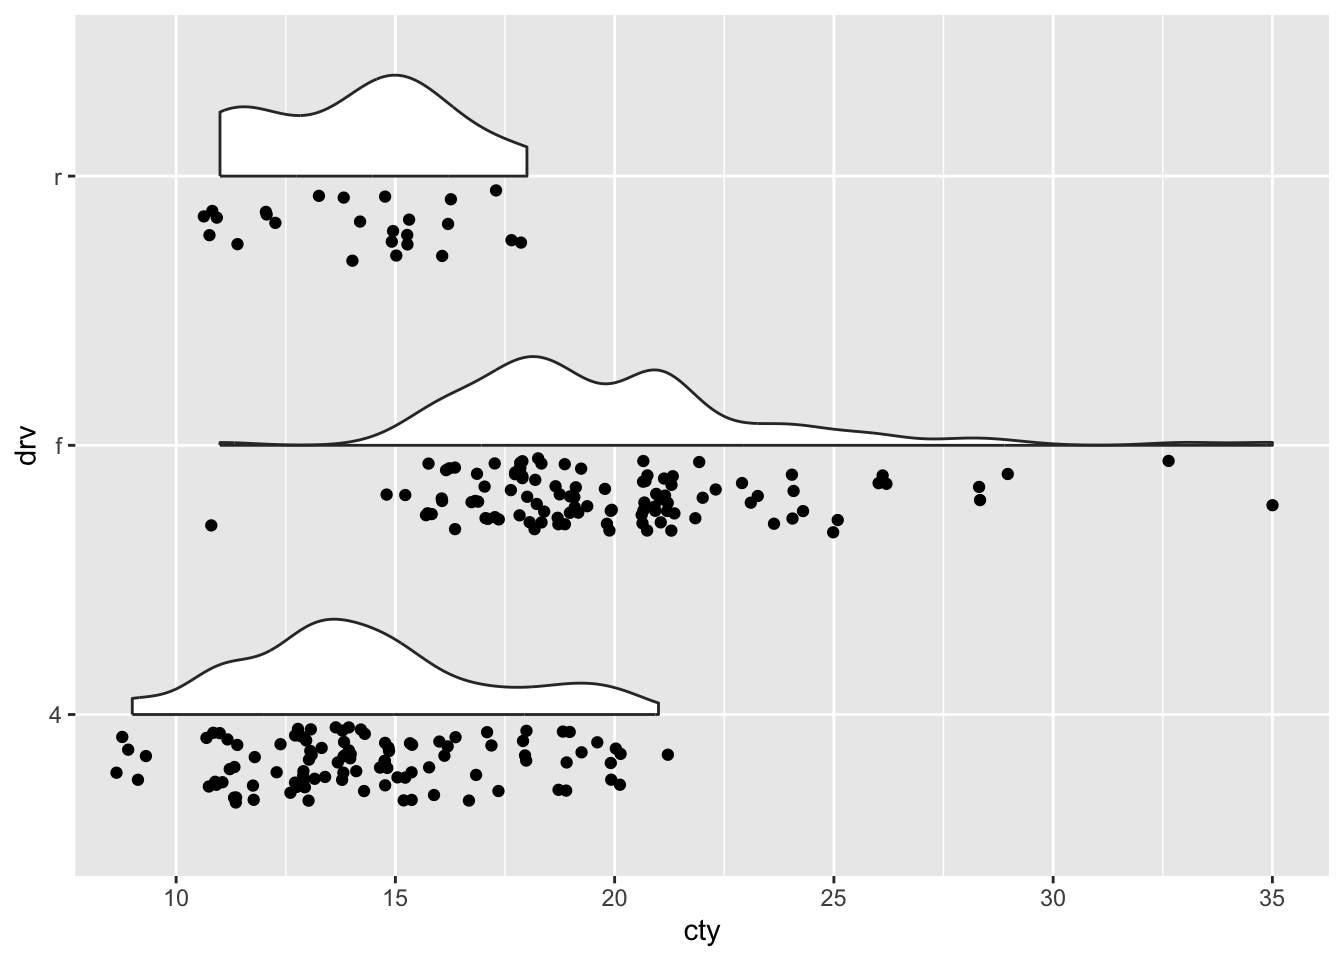
Let’s flip the x- and y-axis for a cloud-and-rain-plot!
ggplot(mpg, aes(x = drv, y = cty)) +
  geom_half_violin(side = "r") +
  geom_half_point(side = "l") +
  coord_flip()